

Social Media Benchmarks by Industry and Networks (2024)
You have put a lot of effort into your social media content, but you are unsure how well it performs, right?
You are not alone.
Many marketers and businesses like you struggle to understand if their social media efforts are hitting the mark or falling flat. But what if you had a clear roadmap to guide you?
Social media benchmarks are your guiding compass, helping you measure how your current performance stacks up against the industry standards and competitors. You can confidently assess your engagement rates, follower growth, and click-through rates against industry standards and revise your social media marketing strategy.
In this blog, we’re discussing benchmarks based on industries and networks to help you level up your marketing game. We have covered metrics such as posts per week, average engagement rate per post, cost per click (CPC), and average CTR.
Keep reading to find out more, but first…
What is a Social Media Benchmark?
A social media benchmark is a standard used to measure and compare the performance of your social media activities. It’s a reference point that tells how your brand stacks up against your competitors, industry average, and even your own past performance.
Benchmarks help you evaluate your social media performance, refine your strategy, and set realistic social media goals.
These benchmarks include several social media metrics such as engagement rate, follower growth, website traffic, etc.
The three main types of benchmarks are industry, competitive, and internal. These benchmarks track past data to identify how your social media performance has changed over time. You can use these benchmarks as a baseline to create effective strategies that drive results.
Now, let’s examine industry benchmarks. We have covered all major industries and shared vital metrics that you should know.
Social Media Benchmarks by Industry
The social media landscape is vast and constantly transforming. What works for your industry might not work for others. That’s where industry-specific benchmarks come in. Use these as a starting point to create tailored strategies.
Alcohol Social Media Benchmarks
Starting with the alcohol industry, it uses social media extensively for brand storytelling and community building. However, due to age-gating and advertising regulations, engagement rates are lower on some platforms.
TikTok remained the number one platform for alcohol brands even though the network continues to show less age-restricted content. Instagram clinched the title of the second-best engaging platform for Alcohol brands to increase reach and create brand awareness.
Here are some metrics to confirm:
- Facebook posts per week: 2.72
- Facebook engagement rate: 0.15%
- Facebook average cost per click: $0.55
- Facebook average click-through-rate: 0.90%
- Instagram posts per week: 3.5
- Instagram engagement rate: 0.85%
- Instagram average cost per click: $0.65
- Instagram average click-through-rate: 0.80%
- TikTok posts per week: 4.2
- TikTok engagement rate: 2.13%
- TikTok average cost per click: $0.45
- TikTok average click-through-rate: 0.38%
- Twitter posts per week: 4.0
- Twitter engagement rate: 0.70%
- Twitter average cost per click: $0.40
- Twitter average click-through-rate: 0.65%
Education Social Media Benchmarks
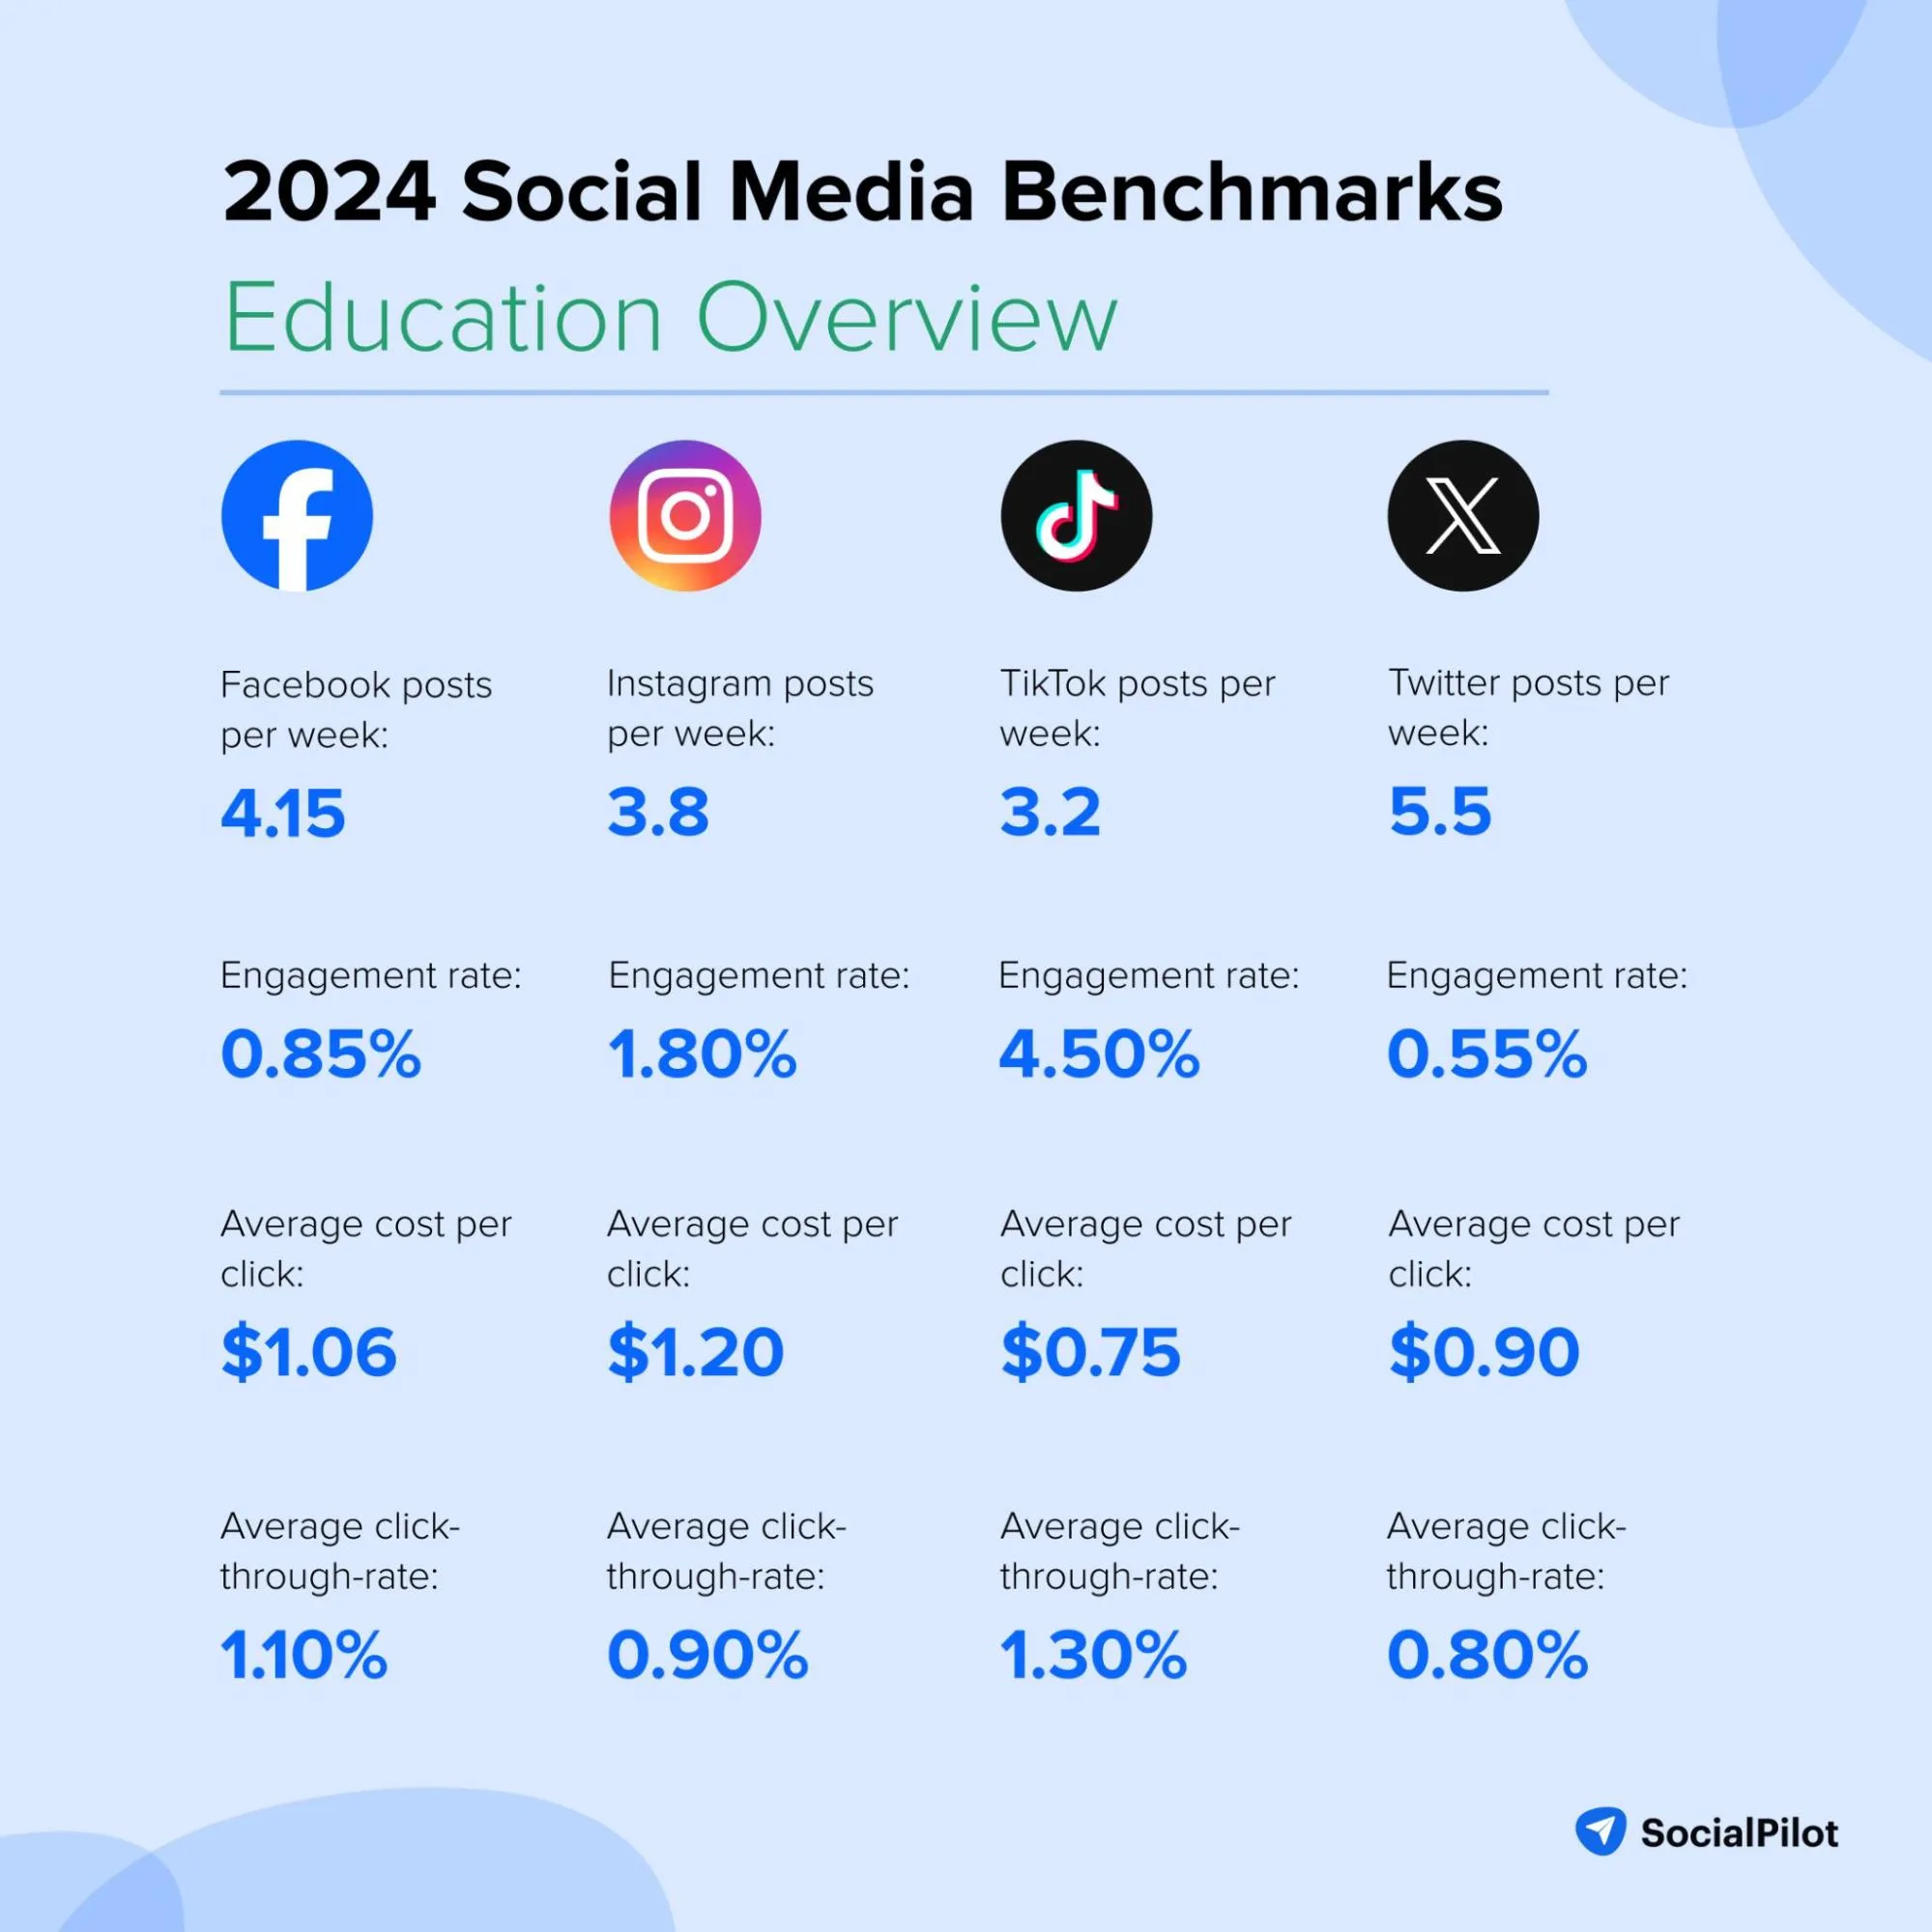
The education industry has started extensively leveraging social media to disseminate information and engage with students and guardians. Informational videos and educational webinars are highly effective. Facebook and Instagram are the primary platforms for sharing updates, and TikTok shows it metal by being the most engaging platform.
- Facebook posts per week: 4.15
- Facebook engagement rate: 0.85%
- Facebook average cost per click: $1.06
- Facebook average click-through-rate: 1.10%
- Instagram posts per week: 3.8
- Instagram engagement rate: 1.80%
- Instagram average cost per click: $1.20
- Instagram average click-through-rate: 0.90%
- TikTok posts per week: 3.2
- TikTok engagement rate: 4.50%
- TikTok average cost per click: $0.75
- TikTok average click-through-rate: 1.30%
- Twitter posts per week: 5.5
- Twitter engagement rate: 0.55%
- Twitter average cost per click: $0.90
- Twitter average click-through-rate: 0.80%
Fashion Social Media Benchmarks
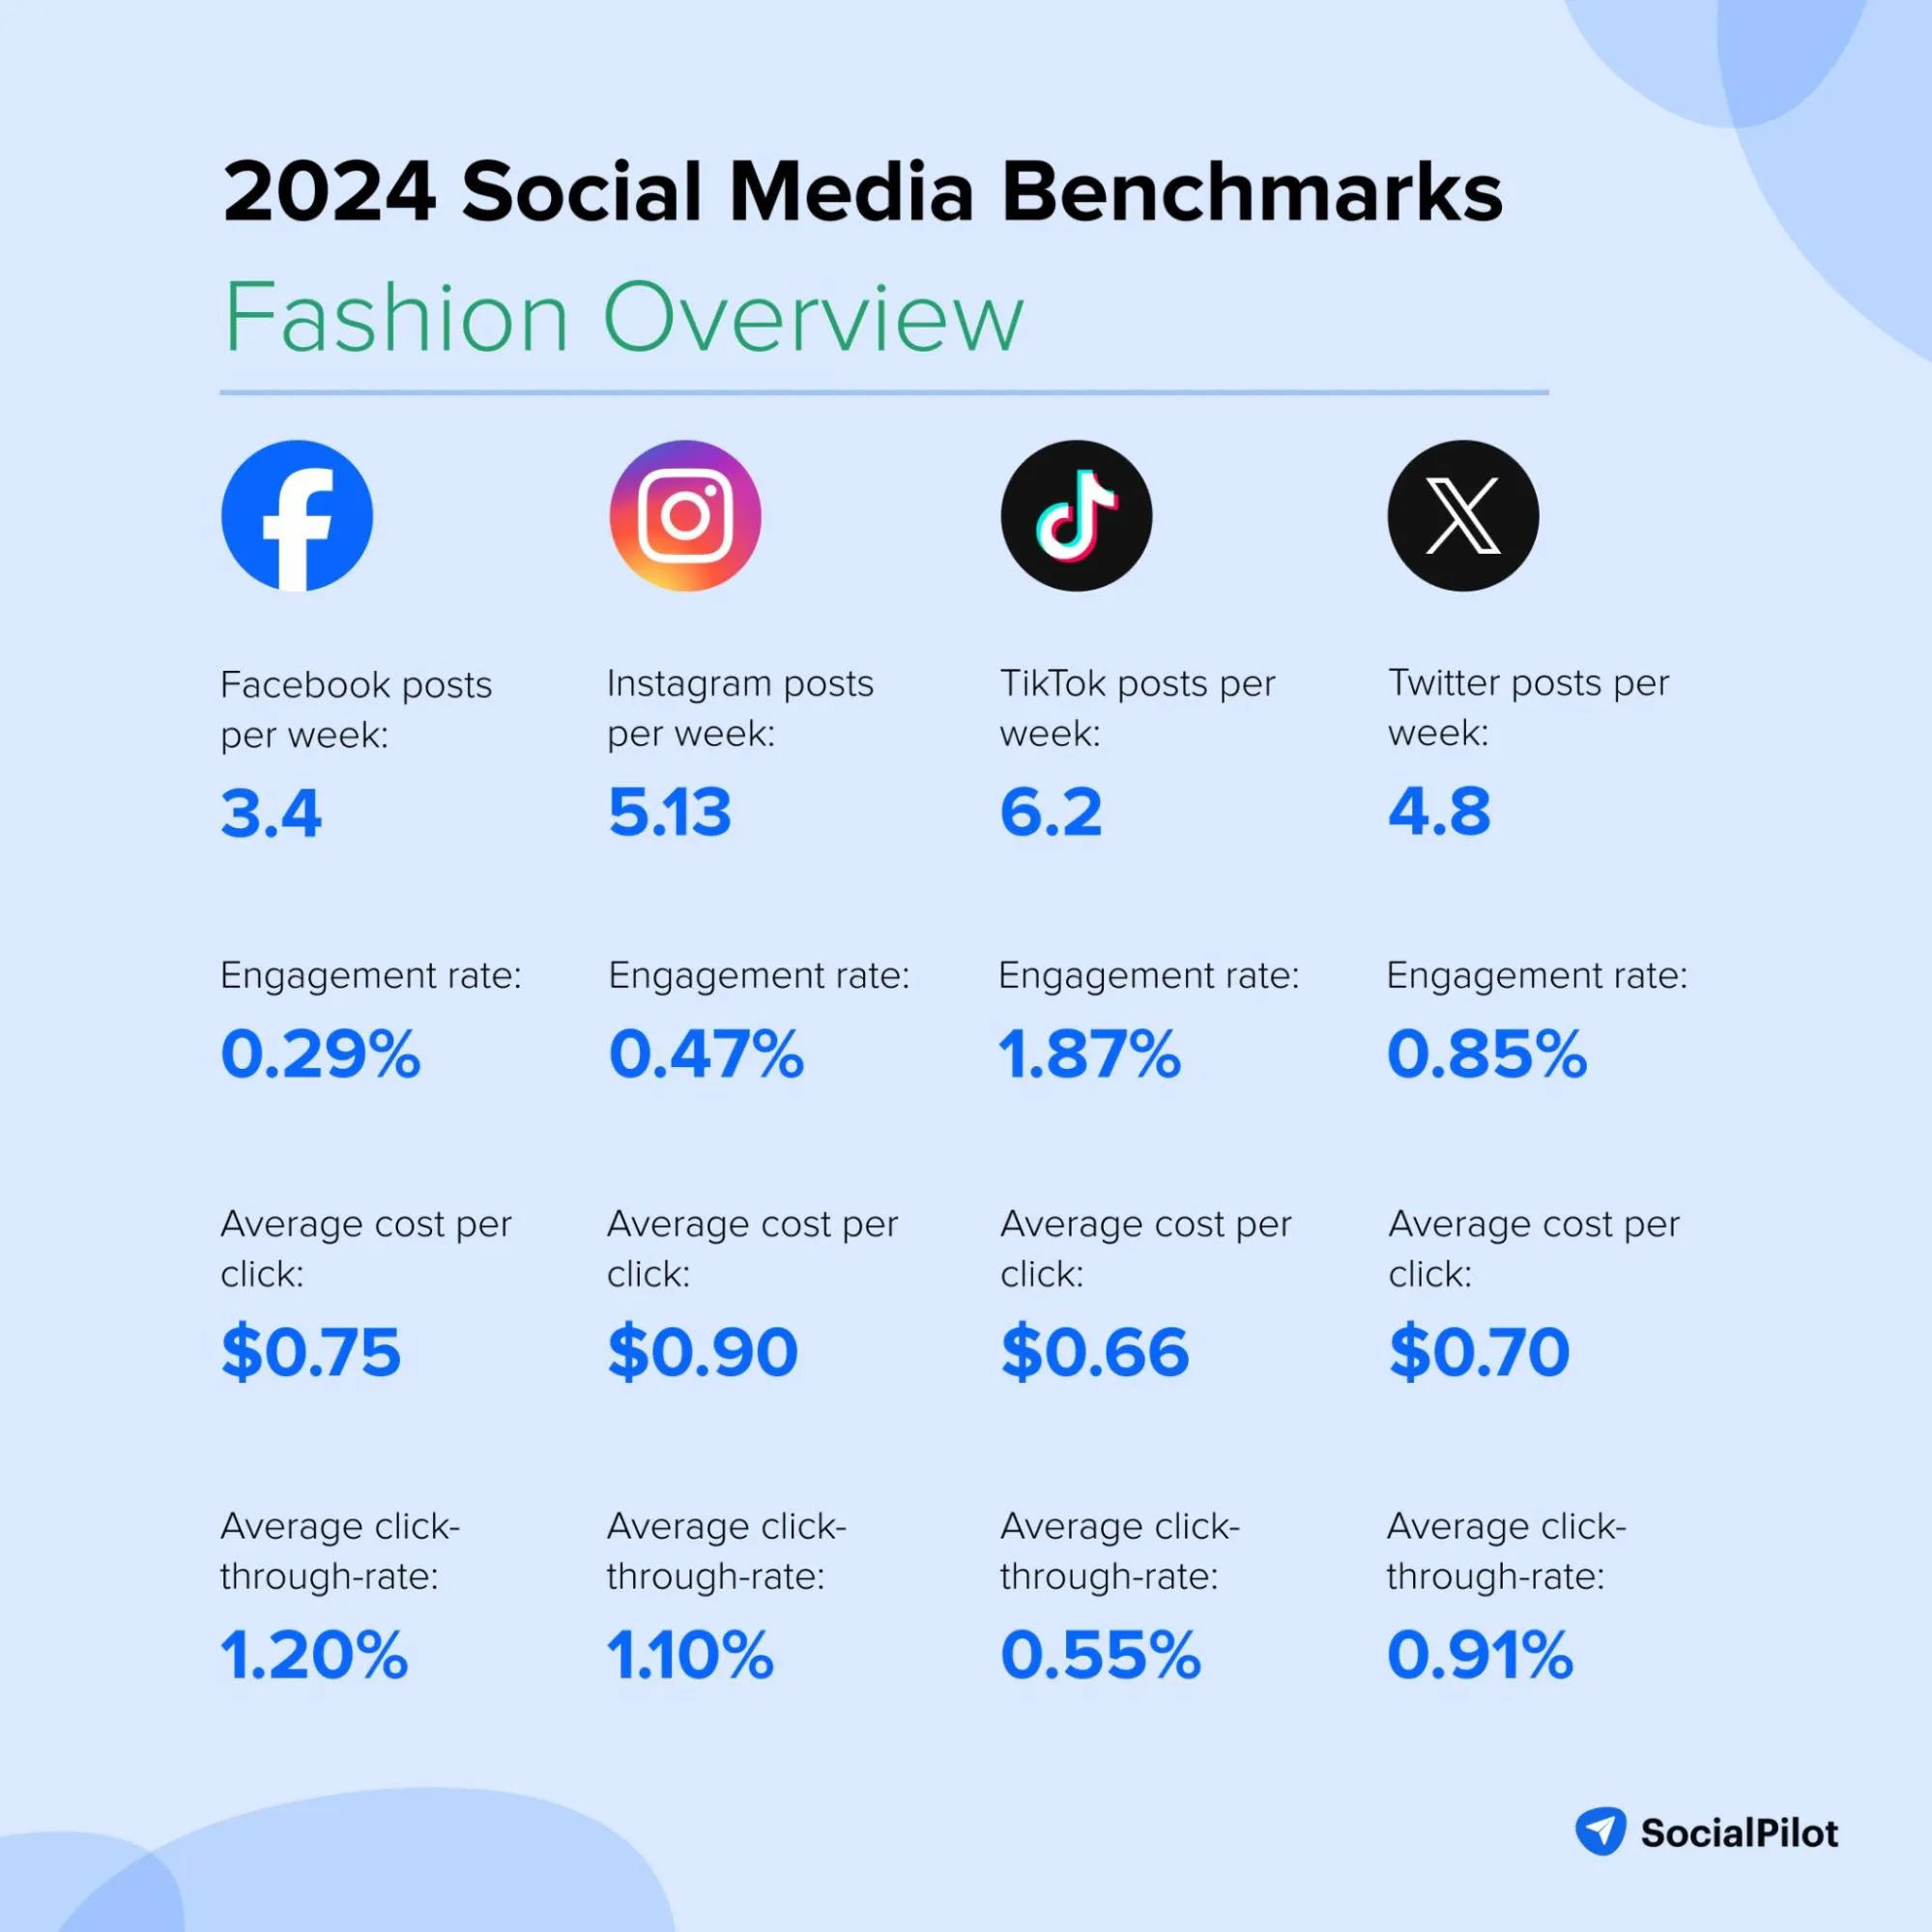
The fashion industry continues to thrive on visually appealing content for its social media success. High-quality images and short video clips, especially on Instagram and TikTok, drive the most engagement and showcase the latest trends. User-generated content and influencer collaborations are playing a significant role in increasing brand visibility and engagement.
- Facebook posts per week: 3.4
- Facebook engagement rate: 0.29%
- Facebook average cost per click: $0.75
- Facebook average click-through-rate: 1.20%
- Instagram posts per week: 5.13
- Instagram engagement rate: 0.47%
- Instagram average cost per click: $0.90
- Instagram average click-through-rate: 1.10%
- TikTok posts per week: 6.2
- TikTok engagement rate: 1.87%
- TikTok average cost per click: $0.66
- TikTok average click-through-rate: 0.55%
- Twitter posts per week: 4.8
- Twitter engagement rate: 0.85%
- Twitter average cost per click: $0.70
- Twitter average click-through-rate: 0.91%
Financial Services Social Media Benchmarks
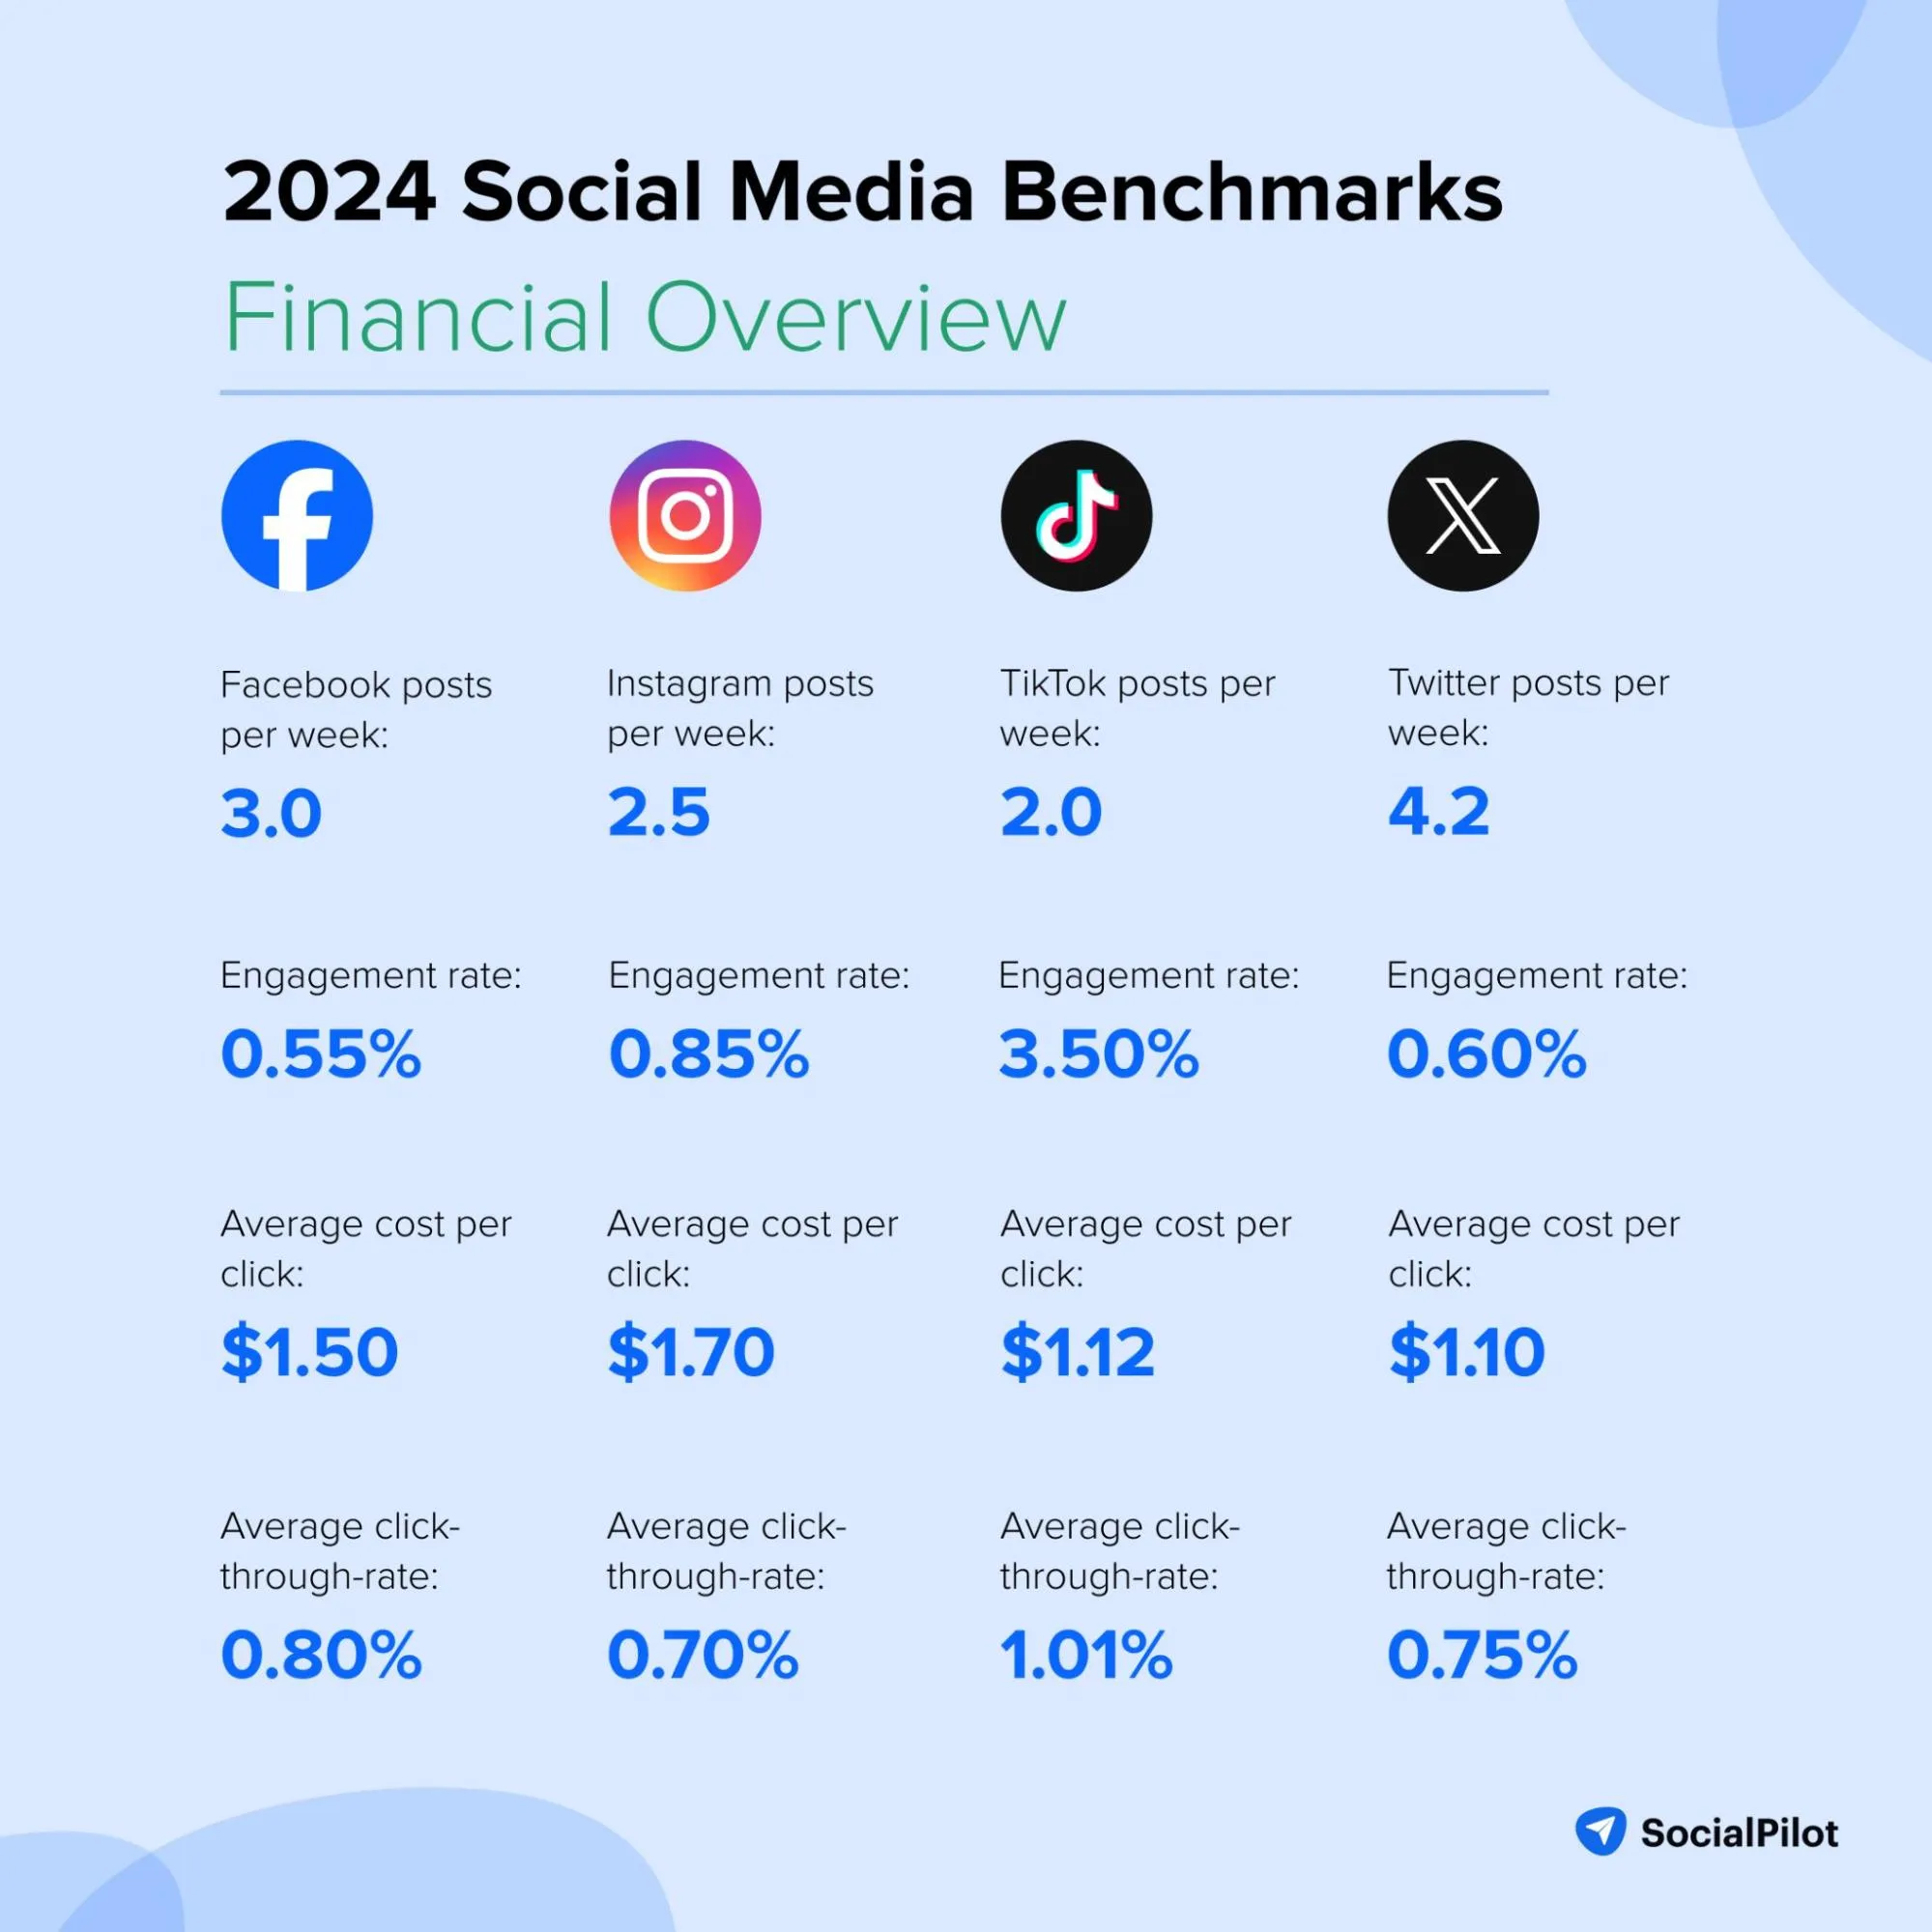
The finance industry uses social media to communicate complex information and educate consumers. Infographics and informative videos are the top-performing content formats, helping to make financial topics more understandable. Twitter and TikTok are the key platforms for sharing insights, while Facebook and Instagram help build a broader community and customer trust.
- Facebook posts per week: 3.0
- Facebook engagement rate: 0.55%
- Facebook average cost per click: $1.50
- Facebook average click-through-rate: 0.80%
- Instagram posts per week: 2.5
- Instagram engagement rate: 0.85%
- Instagram average cost per click: $1.70
- Instagram average click-through-rate: 0.70%
- TikTok posts per week: 2.0
- TikTok engagement rate: 3.50%
- TikTok average cost per click: $1.12
- TikTok average click-through-rate: 1.01%
- Twitter posts per week: 4.2
- Twitter engagement rate: 0.60%
- Twitter average cost per click: $1.10
- Twitter average click-through-rate: 0.75%
Food & Beverage Social Media Benchmarks
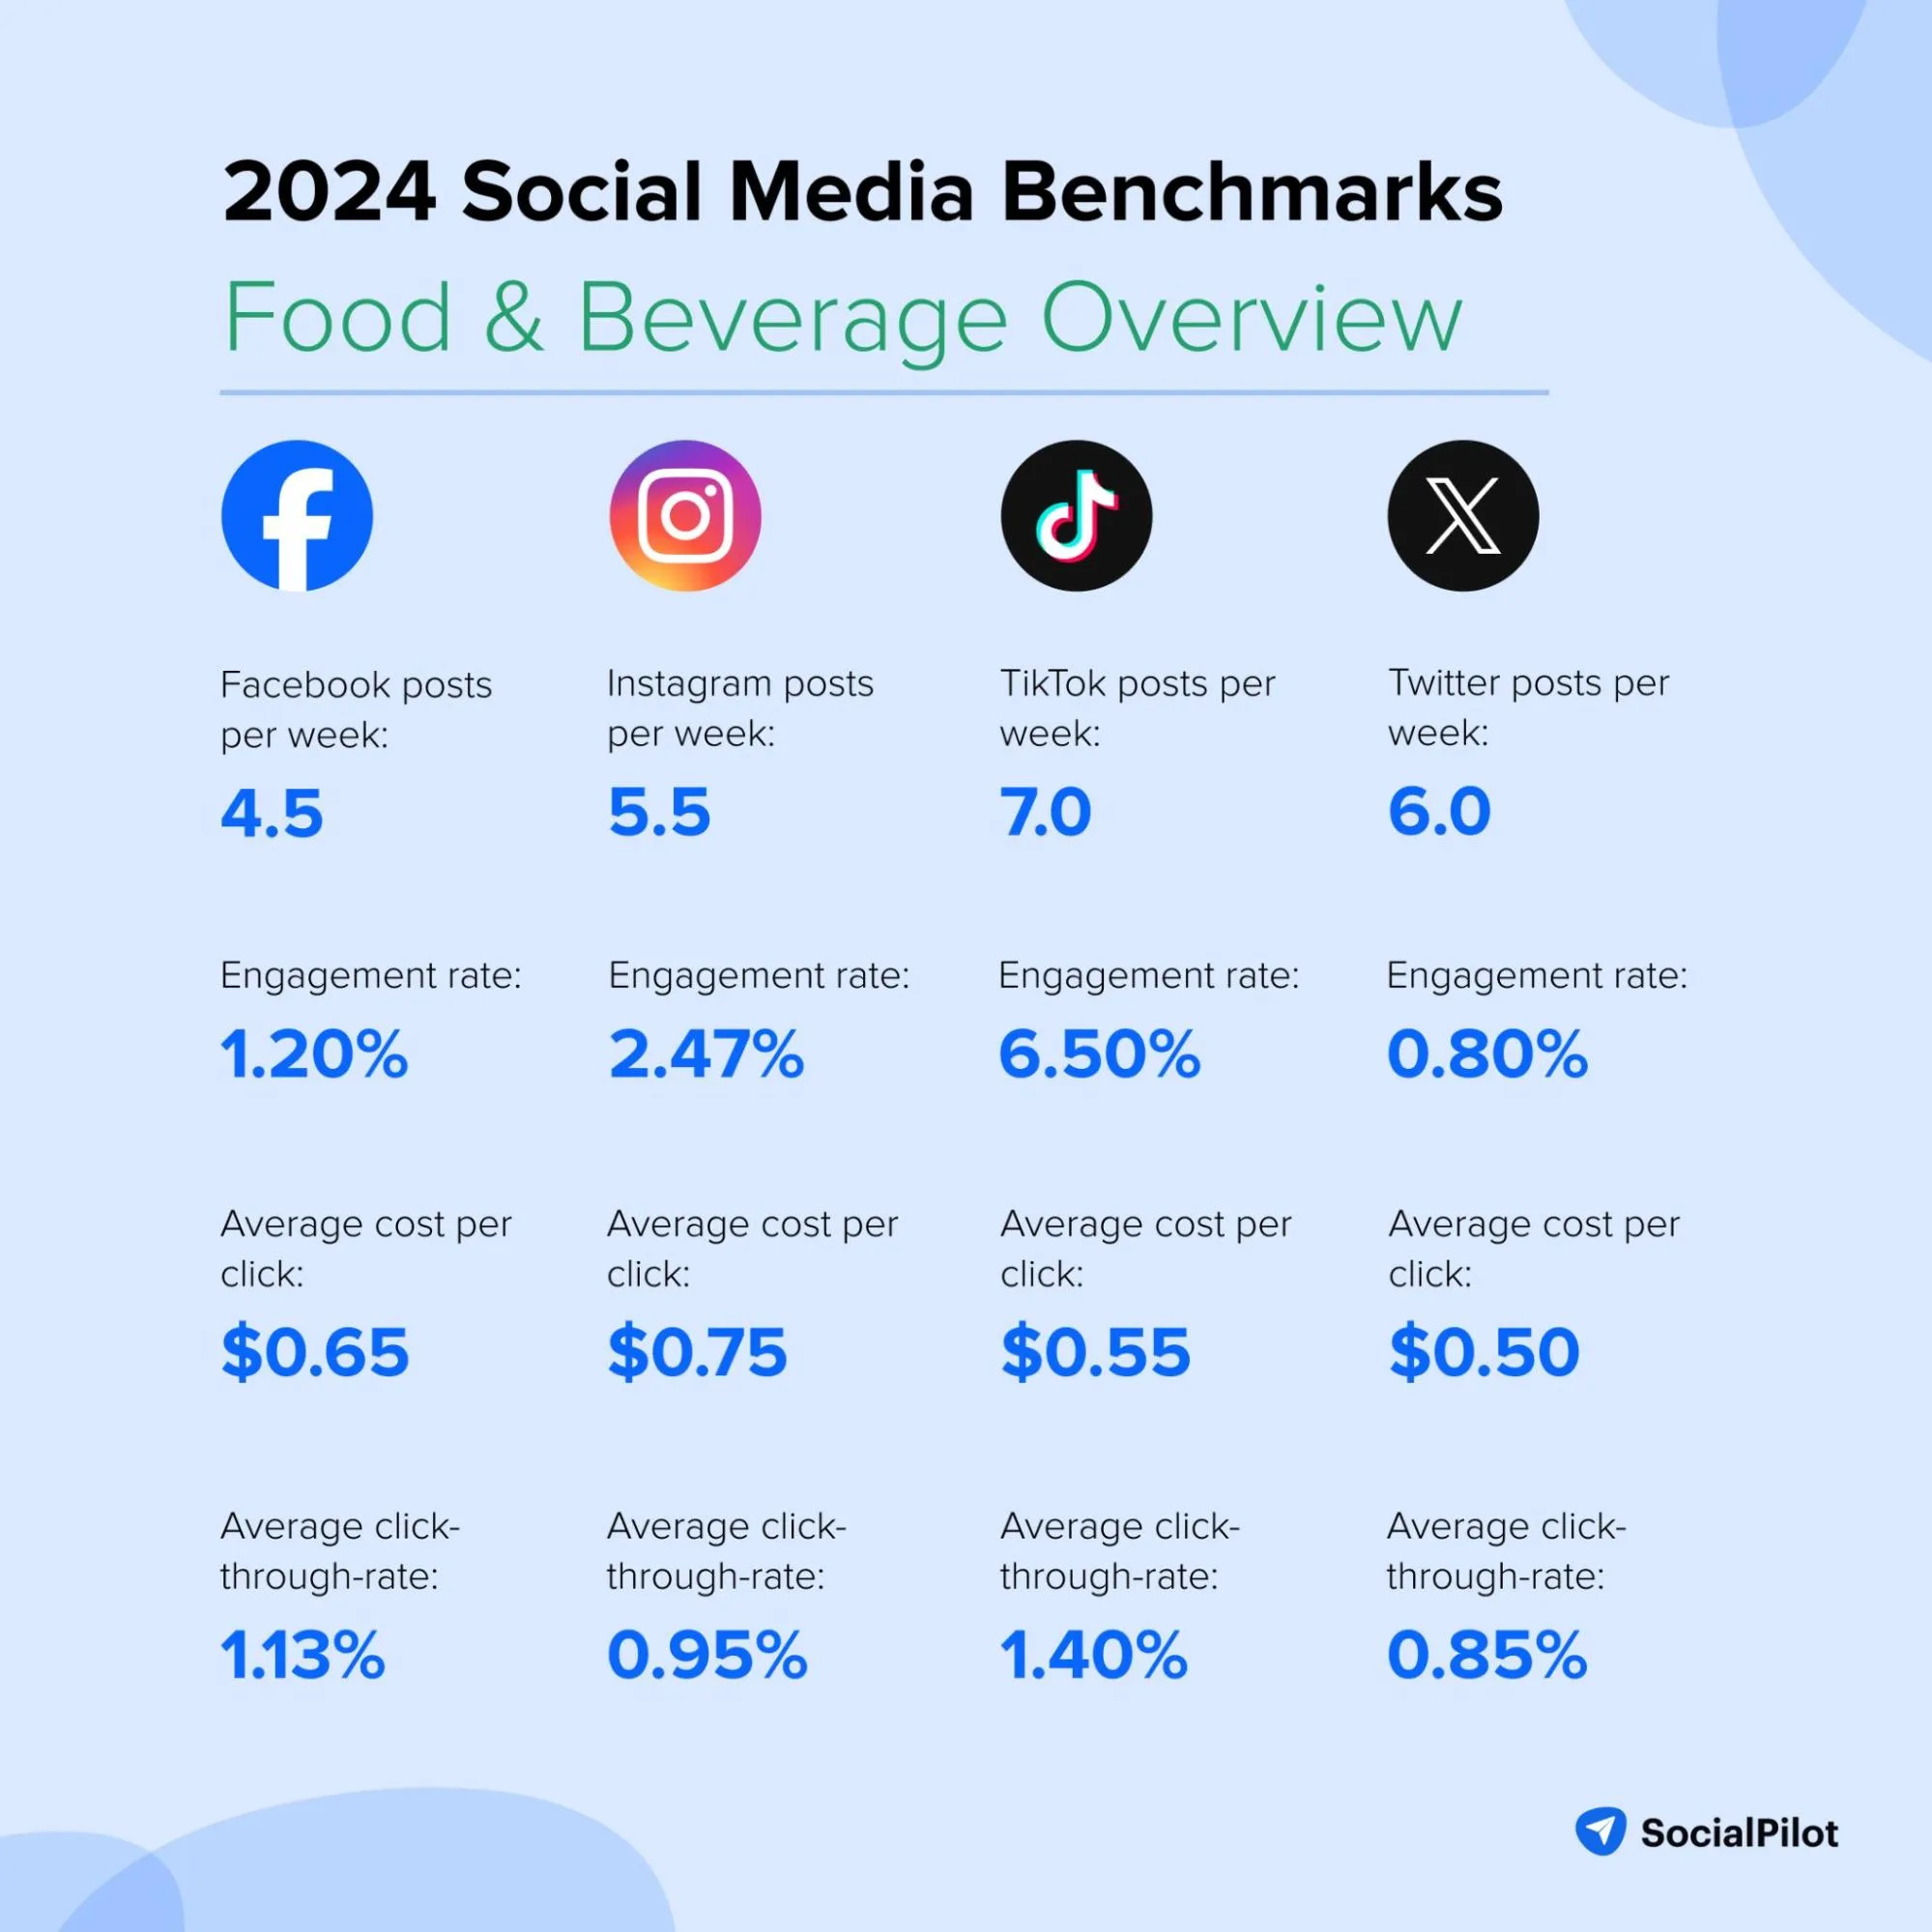
The short recipe videos and cooking tutorials generate the highest engagement in the food and beverage industry. Instagram and TikTok are particularly effective for displaying visually captivating food content that engages a broad audience. UGC, such as customer testimonials and photos, helps boost credibility and community interaction.
- Facebook posts per week: 4.5
- Facebook engagement rate: 1.20%
- Facebook average cost per click: $0.65
- Facebook average click-through-rate: 1.13%
- Instagram posts per week: 5.5
- Instagram engagement rate: 2.47%
- Instagram average cost per click: $0.75
- Instagram average click-through-rate: 0.95%
- TikTok posts per week: 7.0
- TikTok engagement rate: 6.50%
- TikTok average cost per click: $0.55
- TikTok average click-through-rate: 1.40%
- Twitter posts per week: 6.0
- Twitter engagement rate: 0.80%
- Twitter average cost per click: $0.50
- Twitter average click-through-rate: 0.85%
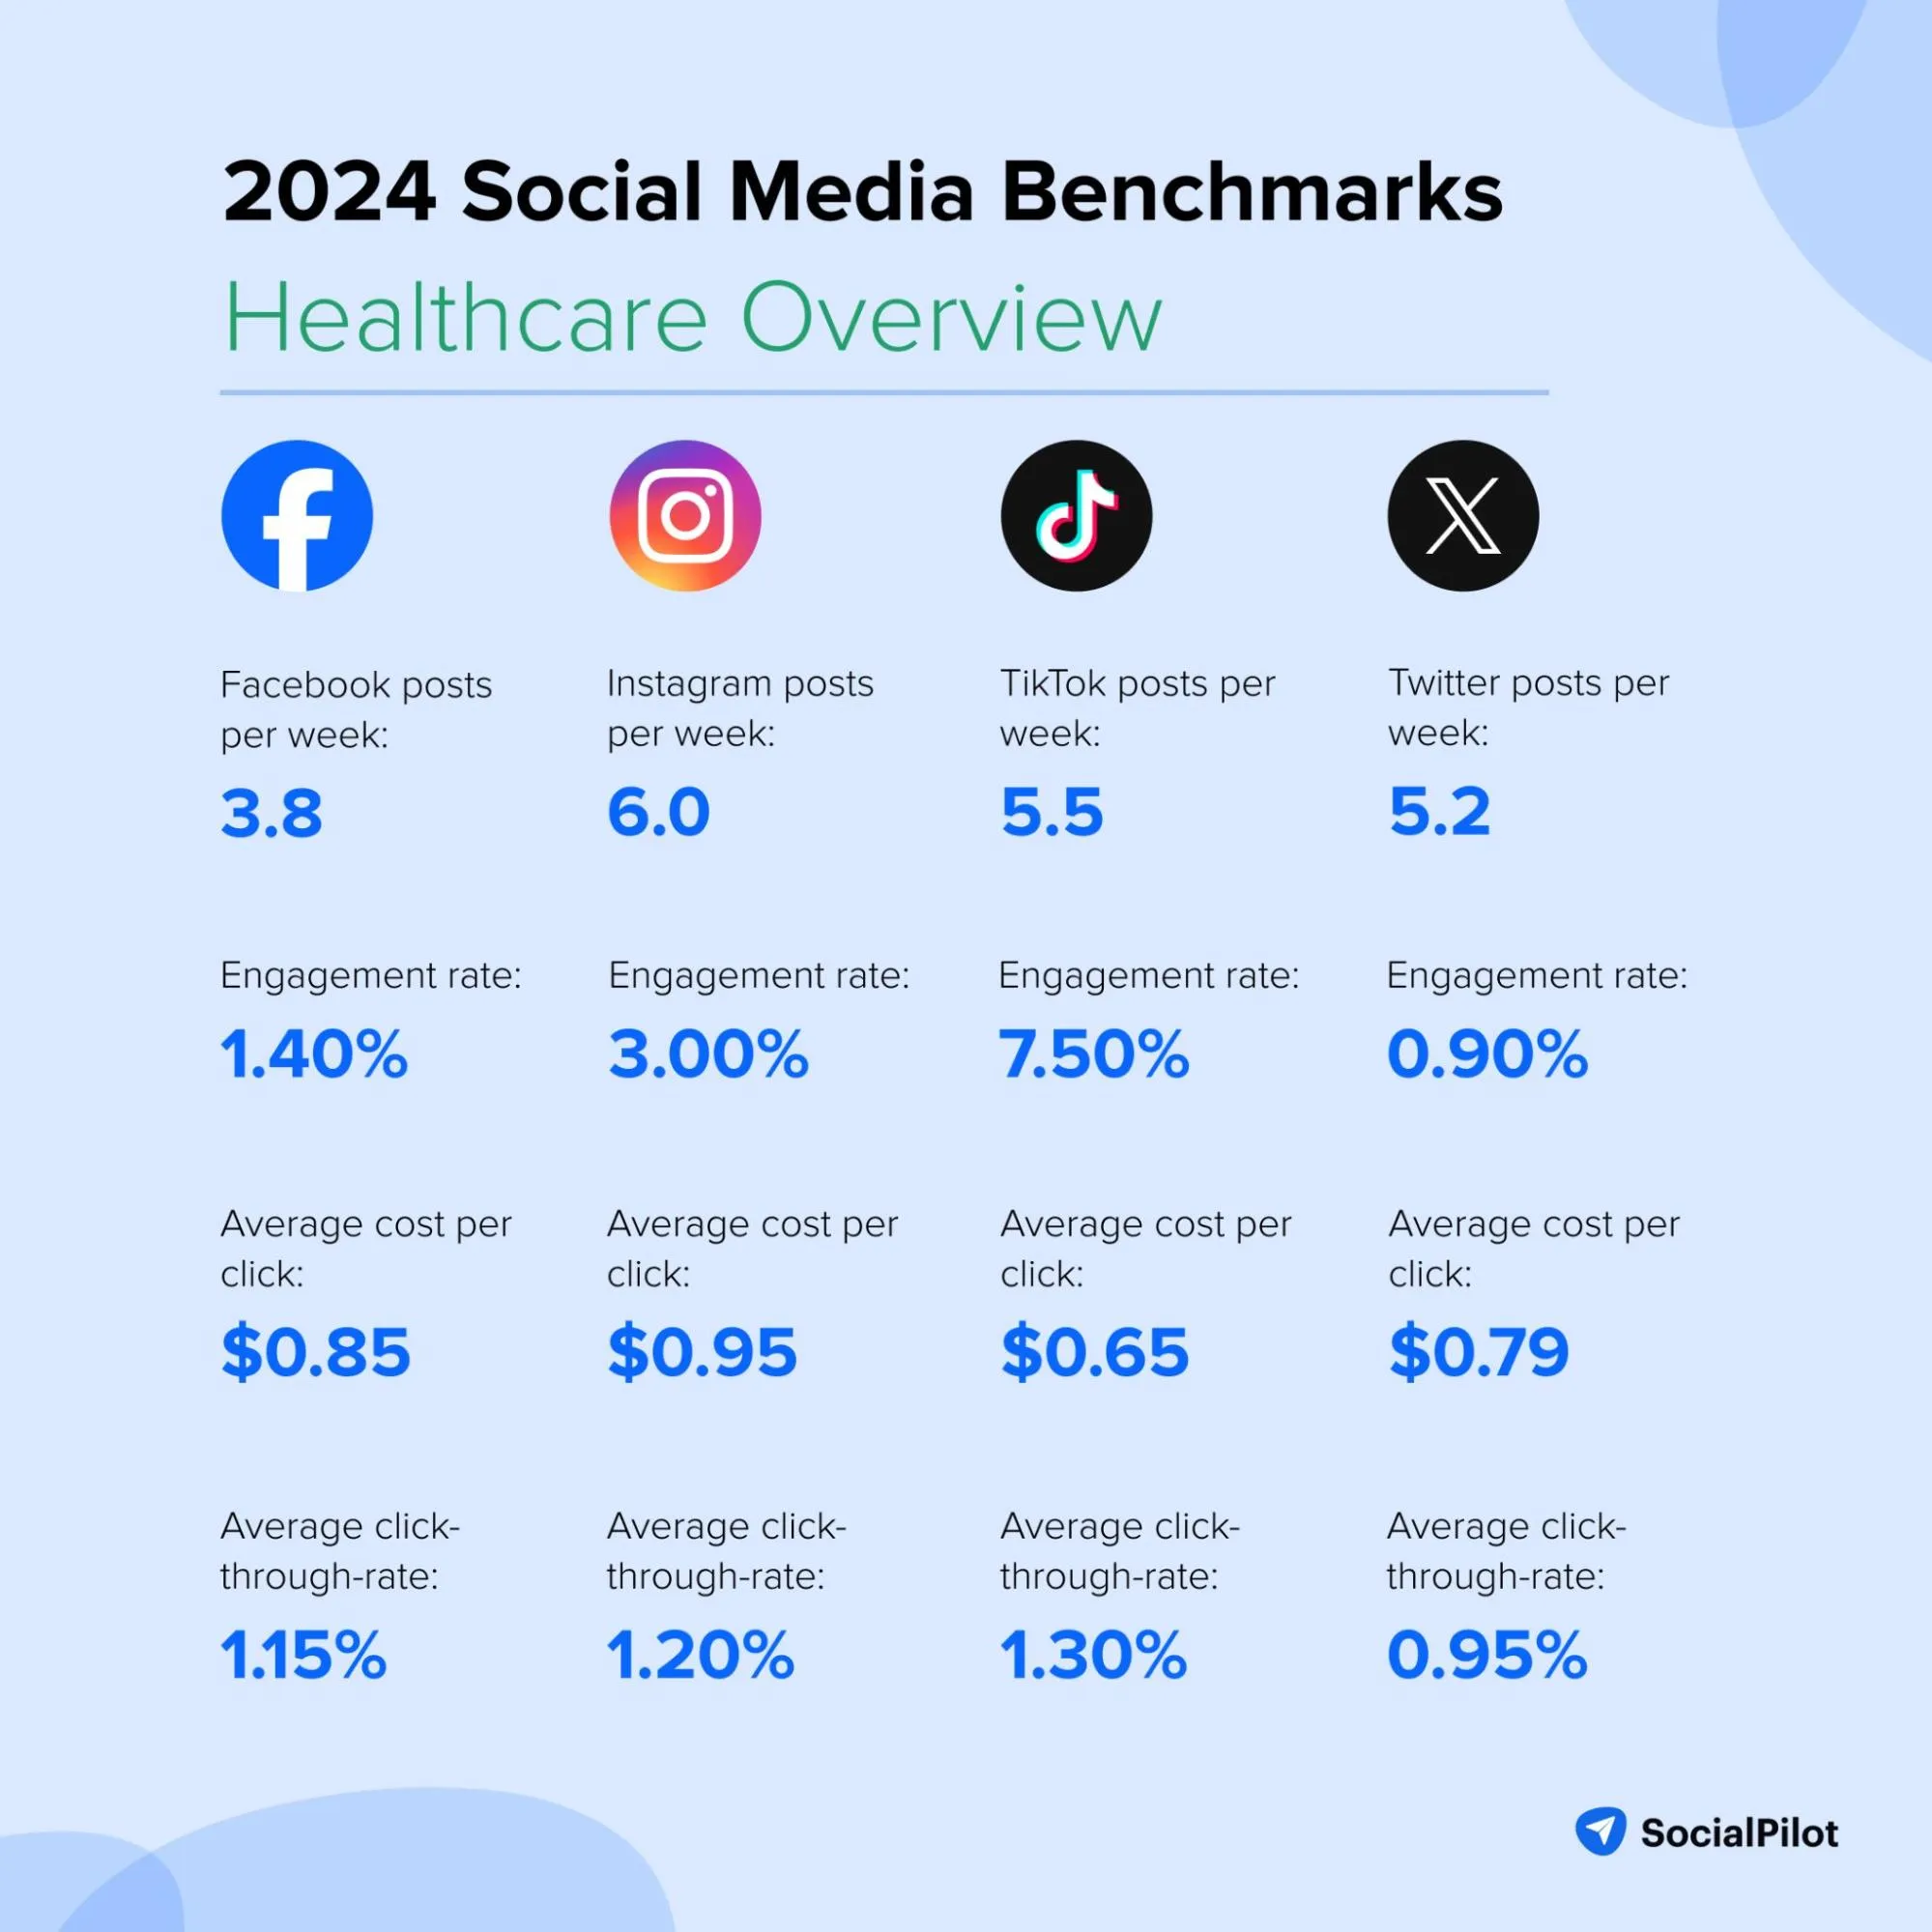
Healthcare Social Media Benchmarks
The healthcare sector is not necessarily a social media-driven industry due to its sensitive nature. Slowly, businesses have started excelling on social media with infographics and informational videos. Based on our benchmark study, we found that the healthcare industry is more active on Instagram and TikTok.
- Facebook posts per week: 3.8
- Facebook engagement rate: 1.40%
- Facebook average cost per click: $0.85
- Facebook average click-through-rate: 1.15%
- Instagram posts per week: 6.0
- Instagram engagement rate: 3.00%
- Instagram average cost per click: $0.95
- Instagram average click-through-rate: 1.20%
- TikTok posts per week: 5.5
- TikTok engagement rate: 7.50%
- TikTok average cost per click: $0.65
- TikTok average click-through-rate: 1.30%
- Twitter posts per week: 5.2
- Twitter engagement rate: 0.90%
- Twitter average cost per click: $0.79
- Twitter average click-through-rate: 0.95%
Home Decor Social Media Benchmarks
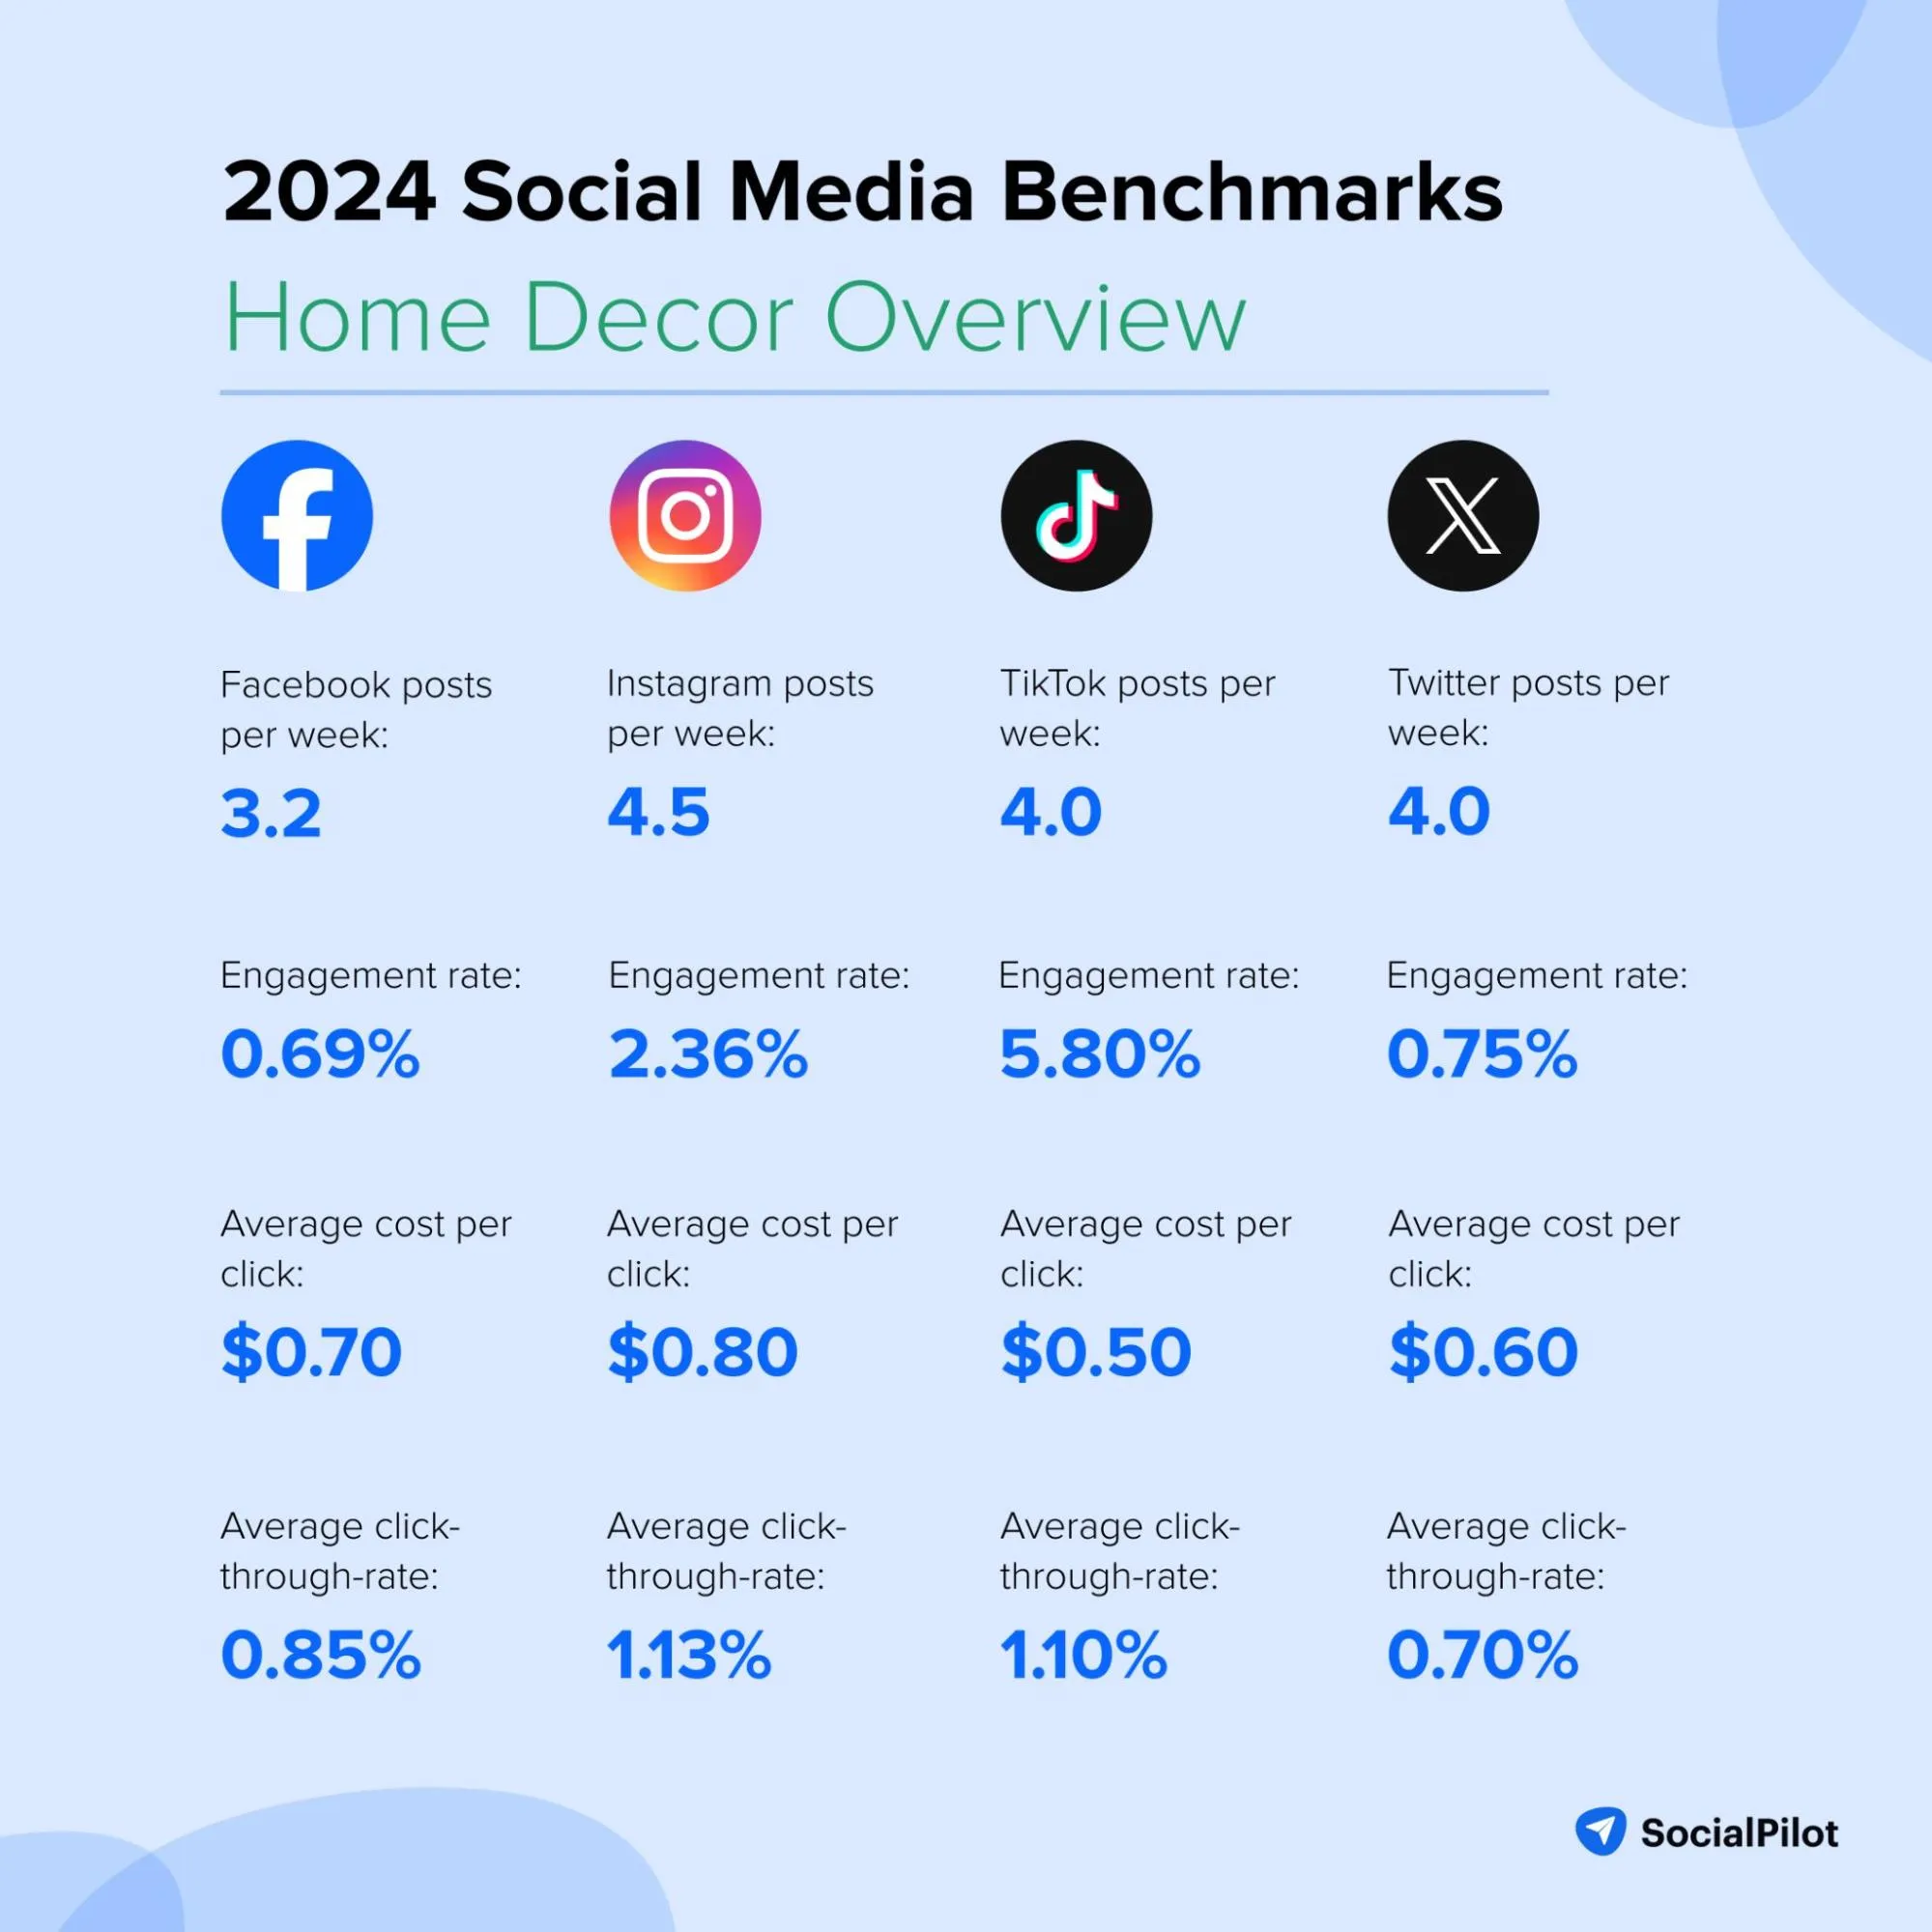
Home decor brands utilize social media posts to inspire audiences with before-and-after photos and DIY project videos. Instagram and TikTok are the most effective platforms for this industry, where visually appealing transformations and practical tips drive significant engagement.
- Facebook posts per week: 3.2
- Facebook engagement rate: 0.69%
- Facebook average cost per click: $0.70
- Facebook average click-through-rate: 0.85%
- Instagram posts per week: 4.5
- Instagram engagement rate: 2.36%
- Instagram average cost per click: $0.80
- Instagram average click-through-rate: 1.13%
- TikTok posts per week: 4.0
- TikTok engagement rate: 5.80%
- TikTok average cost per click: $0.50
- TikTok average click-through-rate: 1.10%
- Twitter posts per week: 4.0
- Twitter engagement rate: 0.75%
- Twitter average cost per click: $0.60
- Twitter average click-through-rate: 0.70%
Media Social Media Benchmarks
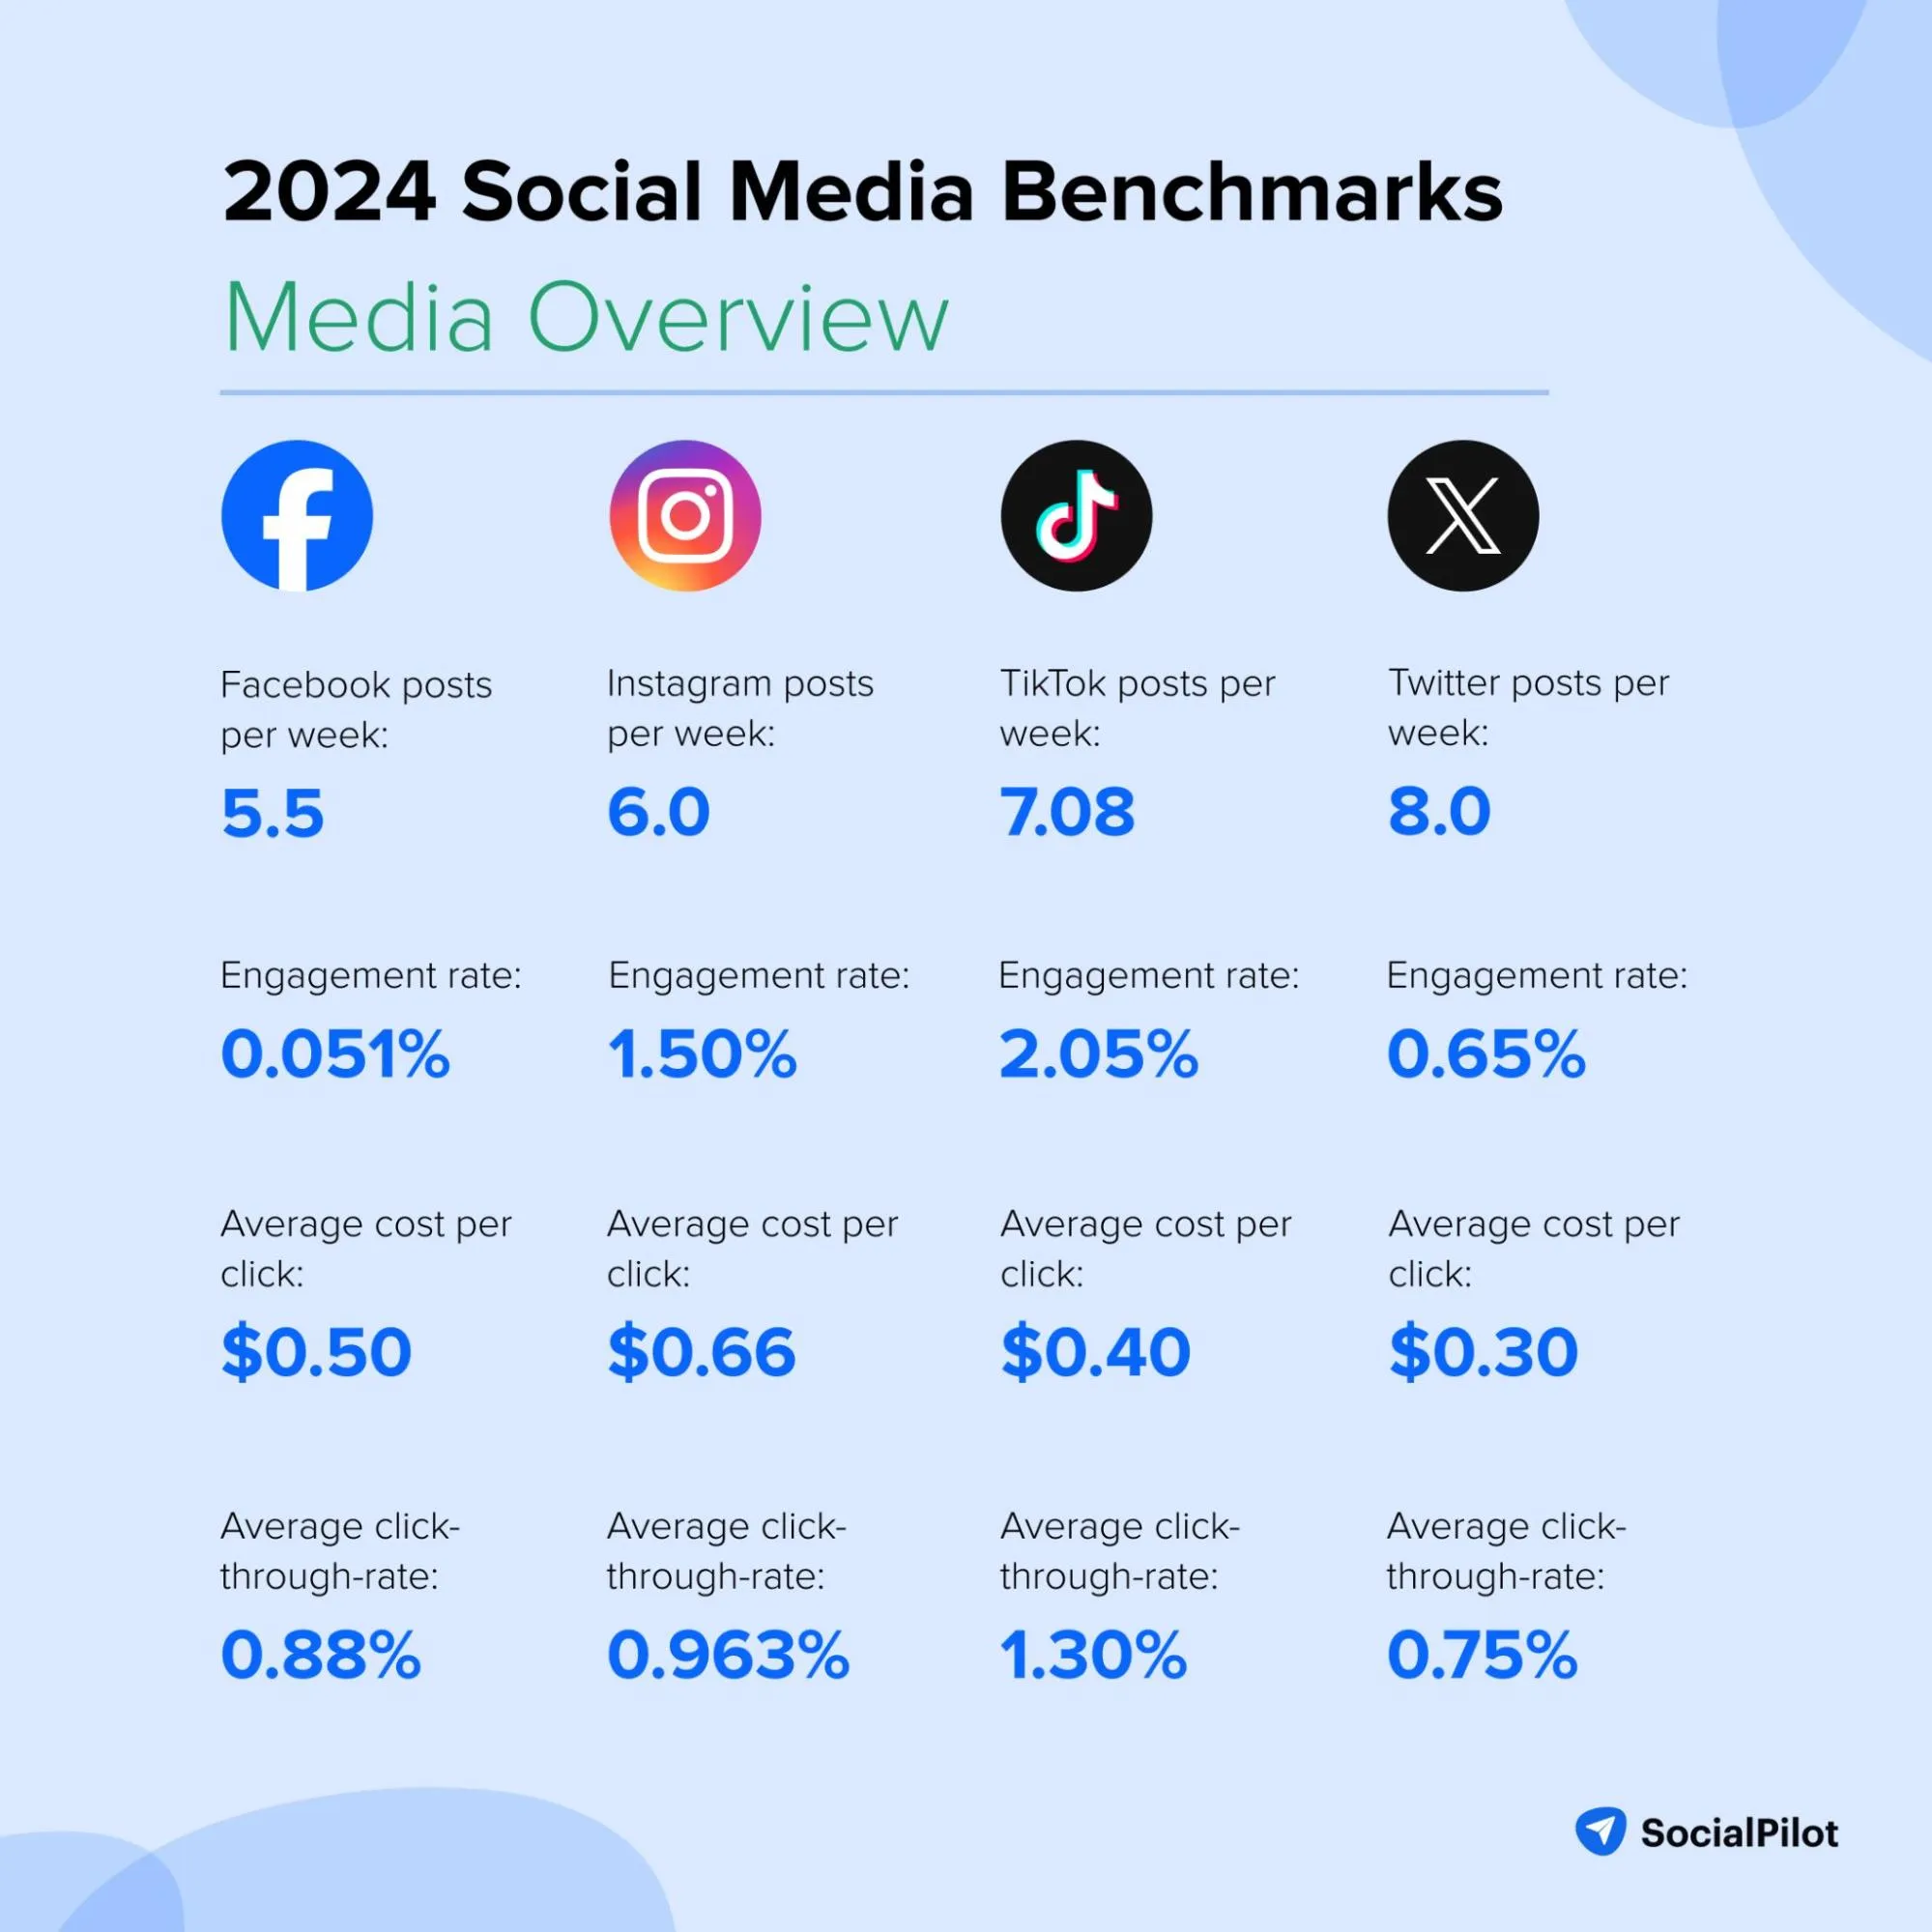
Social media is an accelerator, especially for the media industry, which heavily relies on news, updates, and engaging multimedia content. Short videos and live streams are particularly effective, driving high engagement on platforms like TikTok and Instagram.
- Facebook posts per week: 5.5
- Facebook engagement rate: 0.051%
- Facebook average cost per click: $0.50
- Facebook average click-through-rate: 0.88%
- Instagram posts per week: 6.0
- Instagram engagement rate: 1.50%
- Instagram average cost per click: $0.66
- Instagram average click-through-rate: 0.963%
- TikTok posts per week: 7.08
- TikTok engagement rate: 2.05%
- TikTok average cost per click: $0.40
- TikTok average click-through-rate: 1.30%
- Twitter posts per week: 8.0
- Twitter engagement rate: 0.65%
- Twitter average cost per click: $0.30
- Twitter average click-through-rate: 0.75%
Nonprofit Social Media Benchmarks
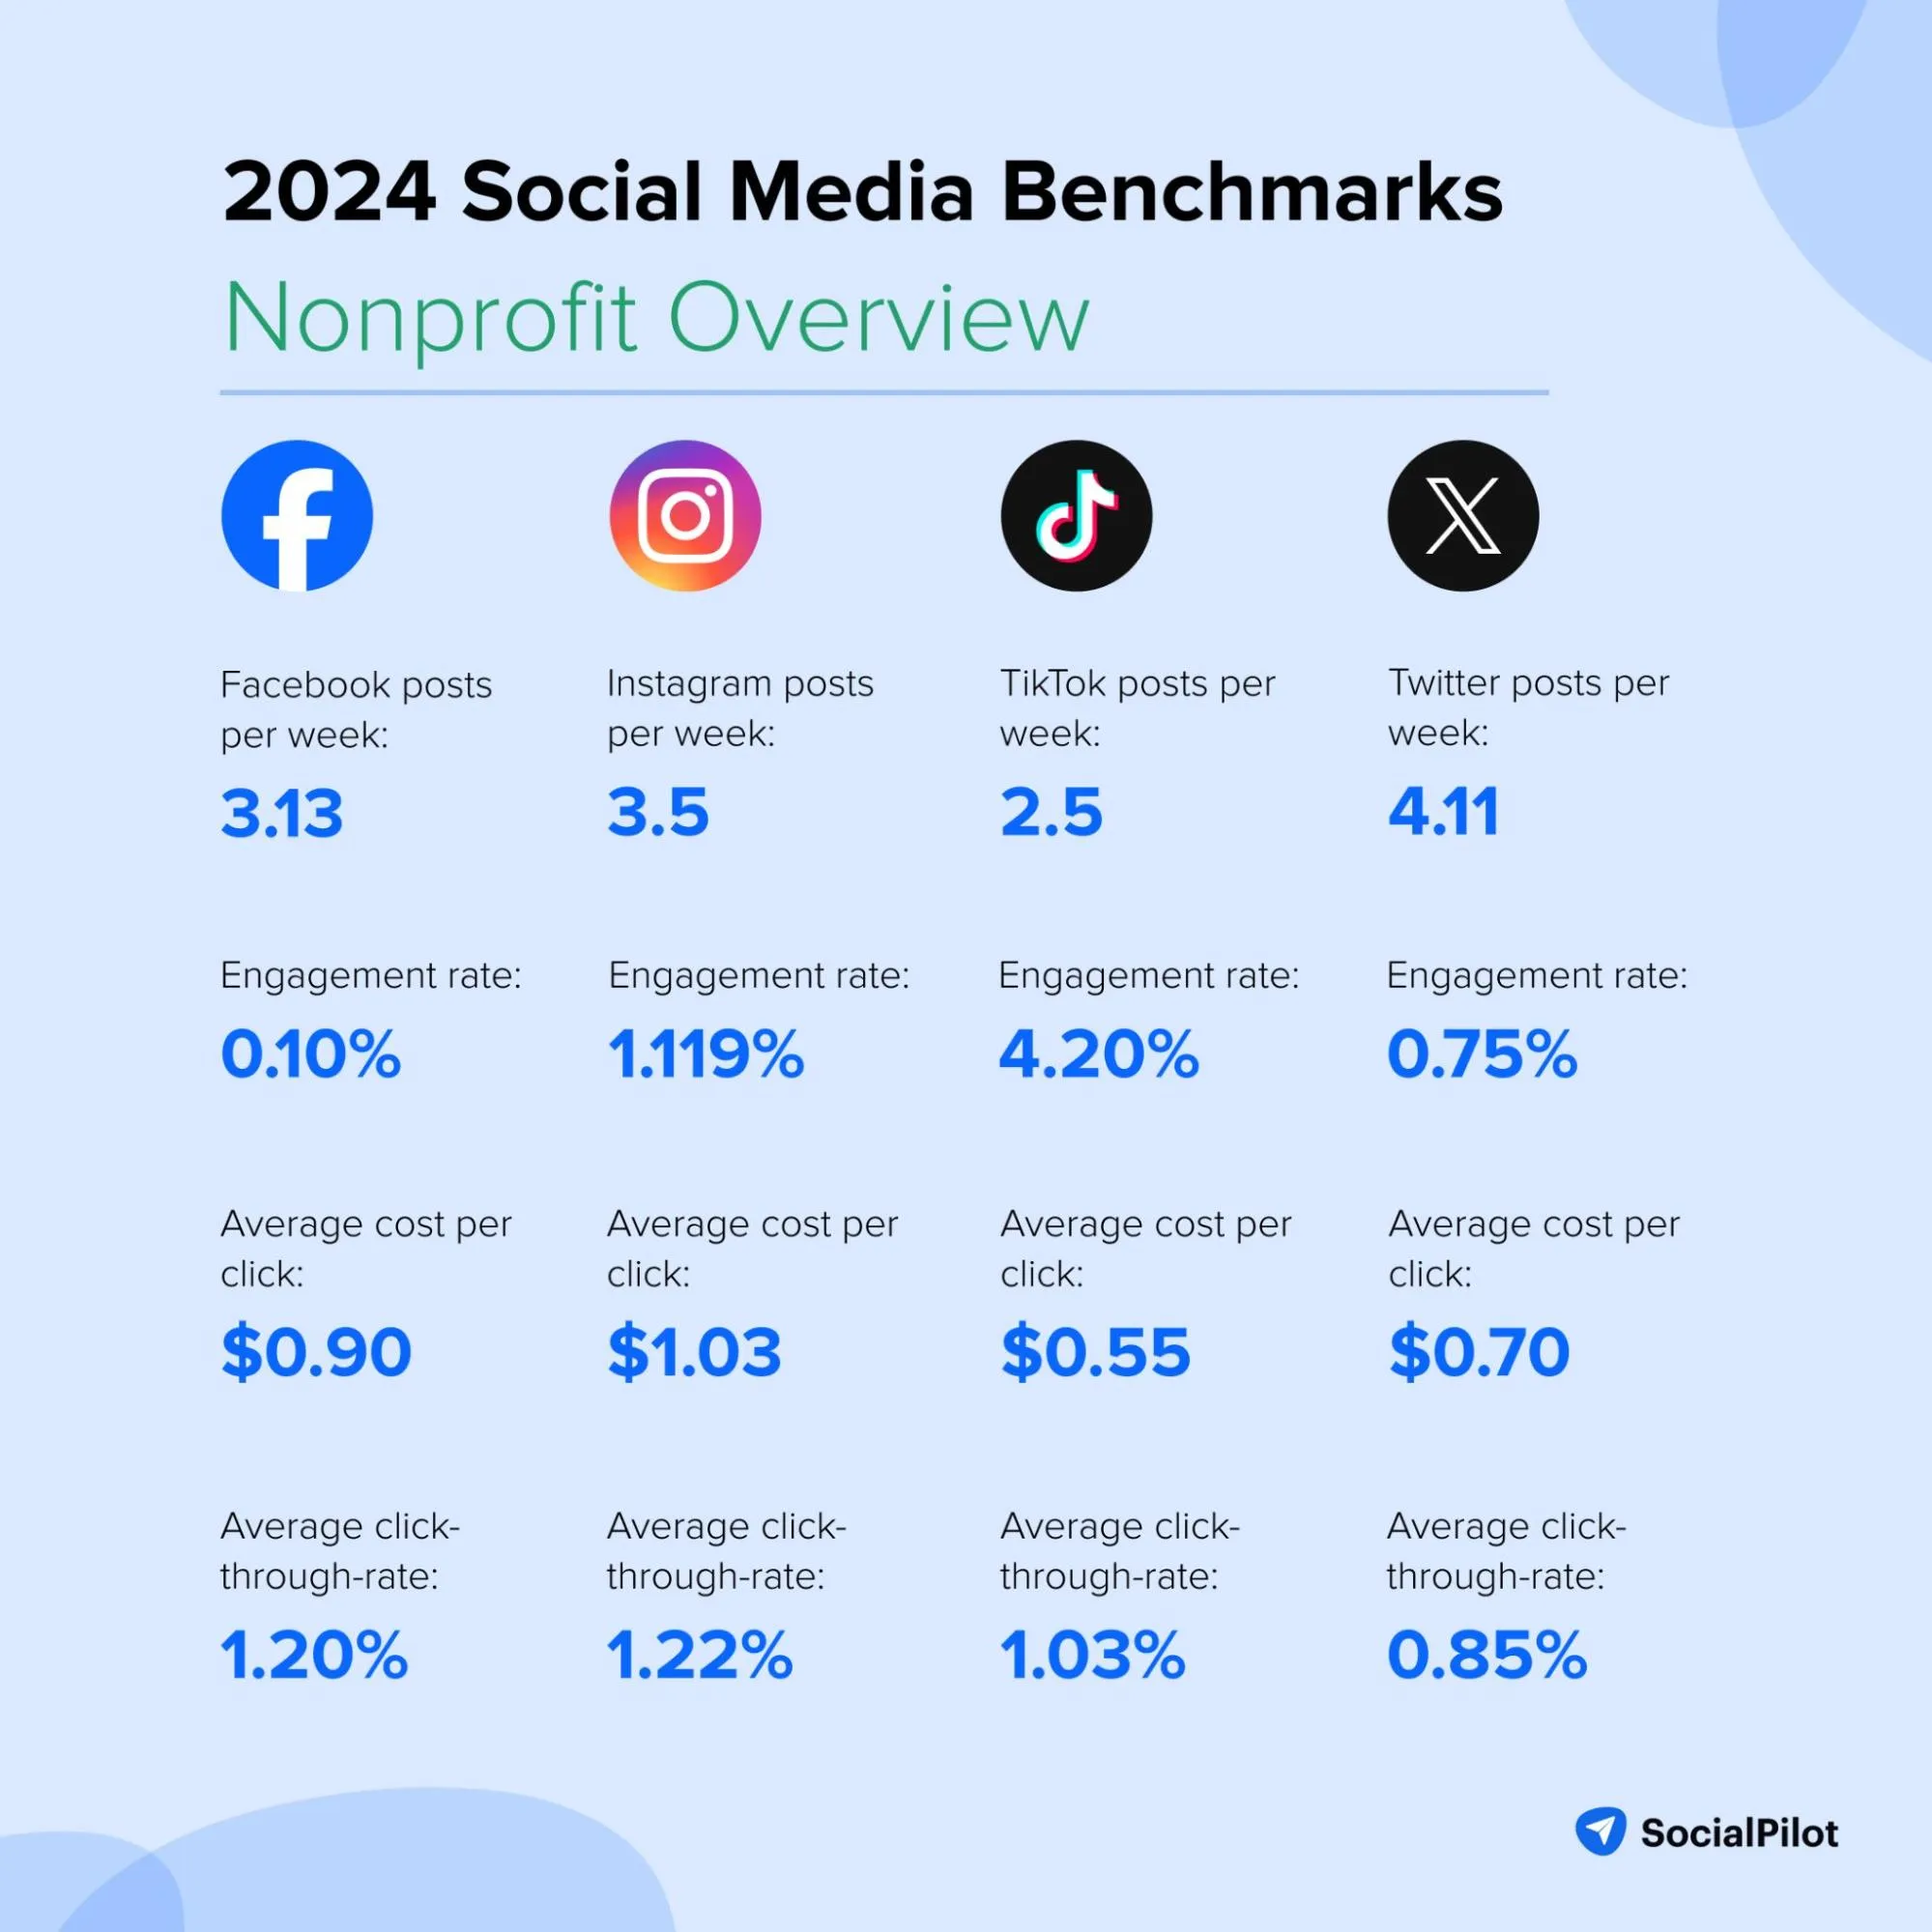
Nonprofits leverage social media to raise awareness, drive donations, and engage with their supporters. Videos highlighting missions and successes generate high engagement on TikTok with 4.20%, while Twitter is used for real-time updates and advocacy.
- Facebook posts per week: 3.13
- Facebook engagement rate: 0.10%
- Facebook average cost per click: $0.90
- Facebook average click-through-rate: 1.20%
- Instagram posts per week: 3.5
- Instagram engagement rate: 1.119%
- Instagram average cost per click: $1.03
- Instagram average click-through-rate: 1.22%
- TikTok posts per week: 2.5
- TikTok engagement rate: 4.20%
- TikTok average cost per click: $0.55
- TikTok average click-through-rate: 1.03%
- Twitter posts per week: 4.11
- Twitter engagement rate: 0.75%
- Twitter average cost per click: $0.70
- Twitter average click-through-rate: 0.85%
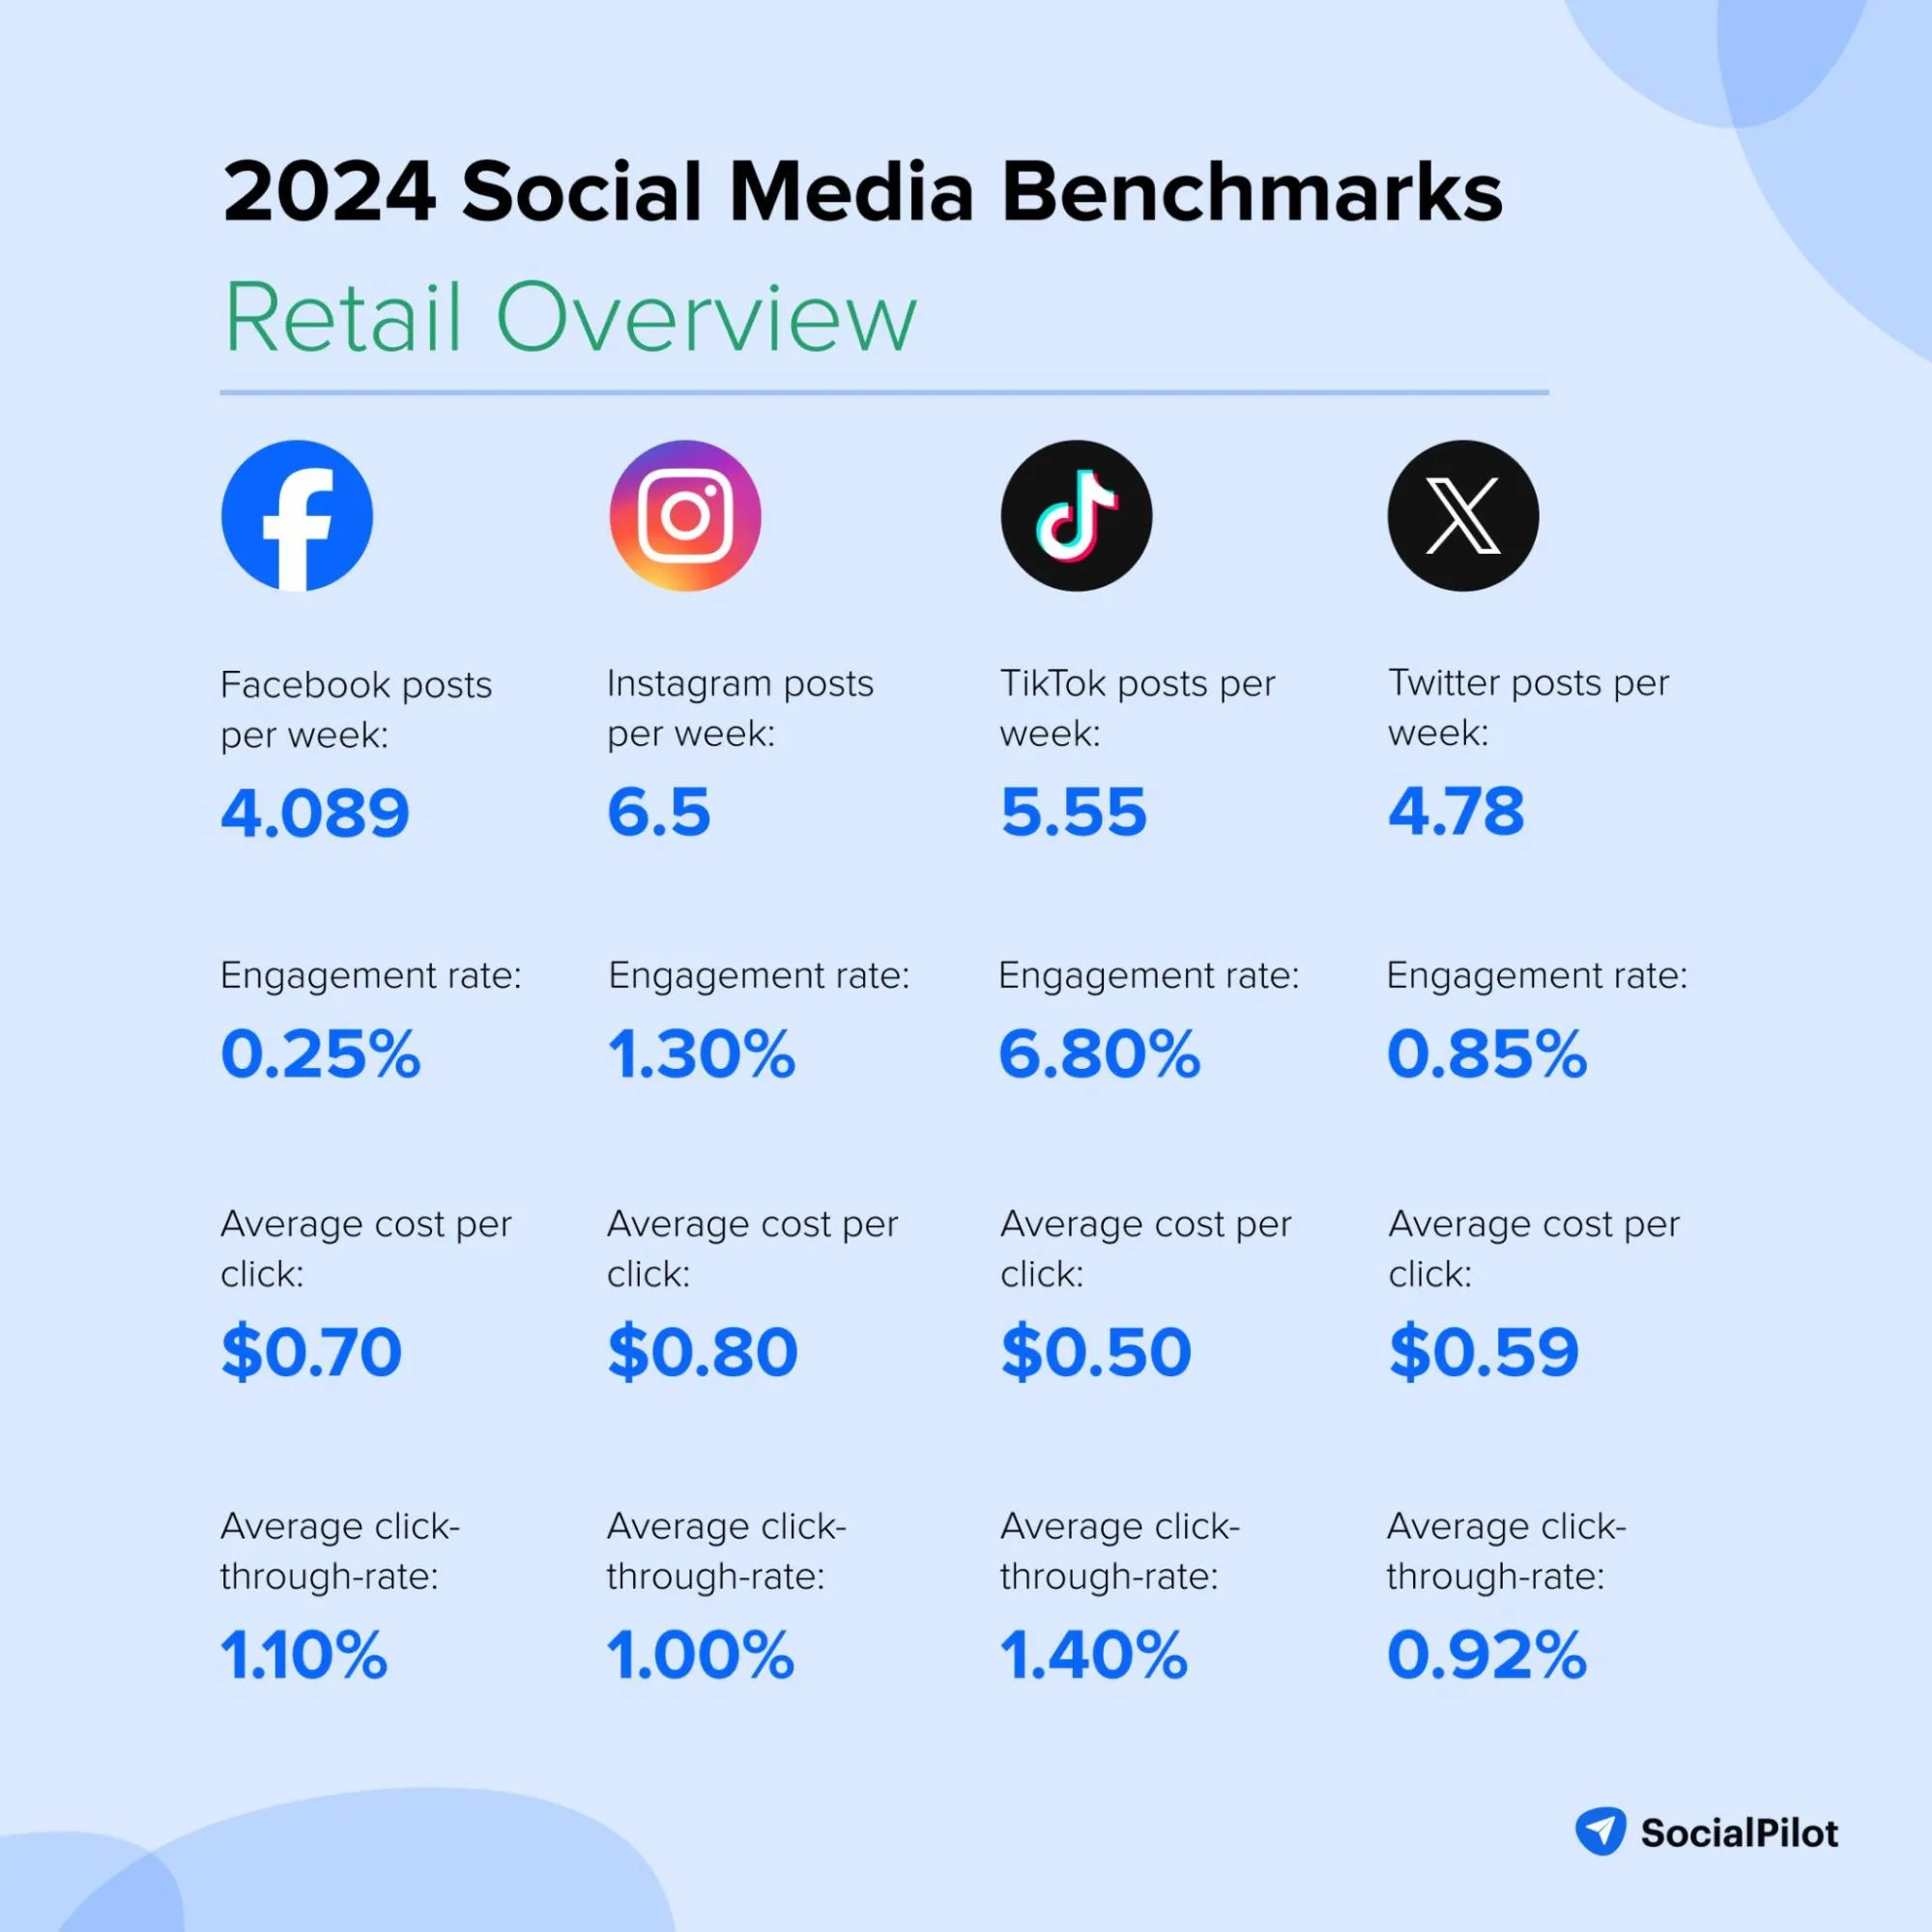
Retail Social Media Benchmarks
The retail industry uses social media to showcase products and promotions through high-quality images and videos. Instagram and TikTok are the top platforms for driving sales and engagement, utilizing shoppable posts and influencer partnerships.
- Facebook posts per week: 4.089
- Facebook engagement rate: 0.25%
- Facebook average cost per click: $0.70
- Facebook average click-through-rate: 1.10%
- Instagram posts per week: 6.5
- Instagram engagement rate: 1.30%
- Instagram average cost per click: $0.80
- Instagram average click-through-rate: 1.00%
- TikTok posts per week: 5.55
- TikTok engagement rate: 6.80%
- TikTok average cost per click: $0.50
- TikTok average click-through-rate: 1.40%
- Twitter posts per week: 4.78
- Twitter engagement rate: 0.85%
- Twitter average cost per click: $0.59
- Twitter average click-through-rate: 0.92%
Software Social Media Benchmarks
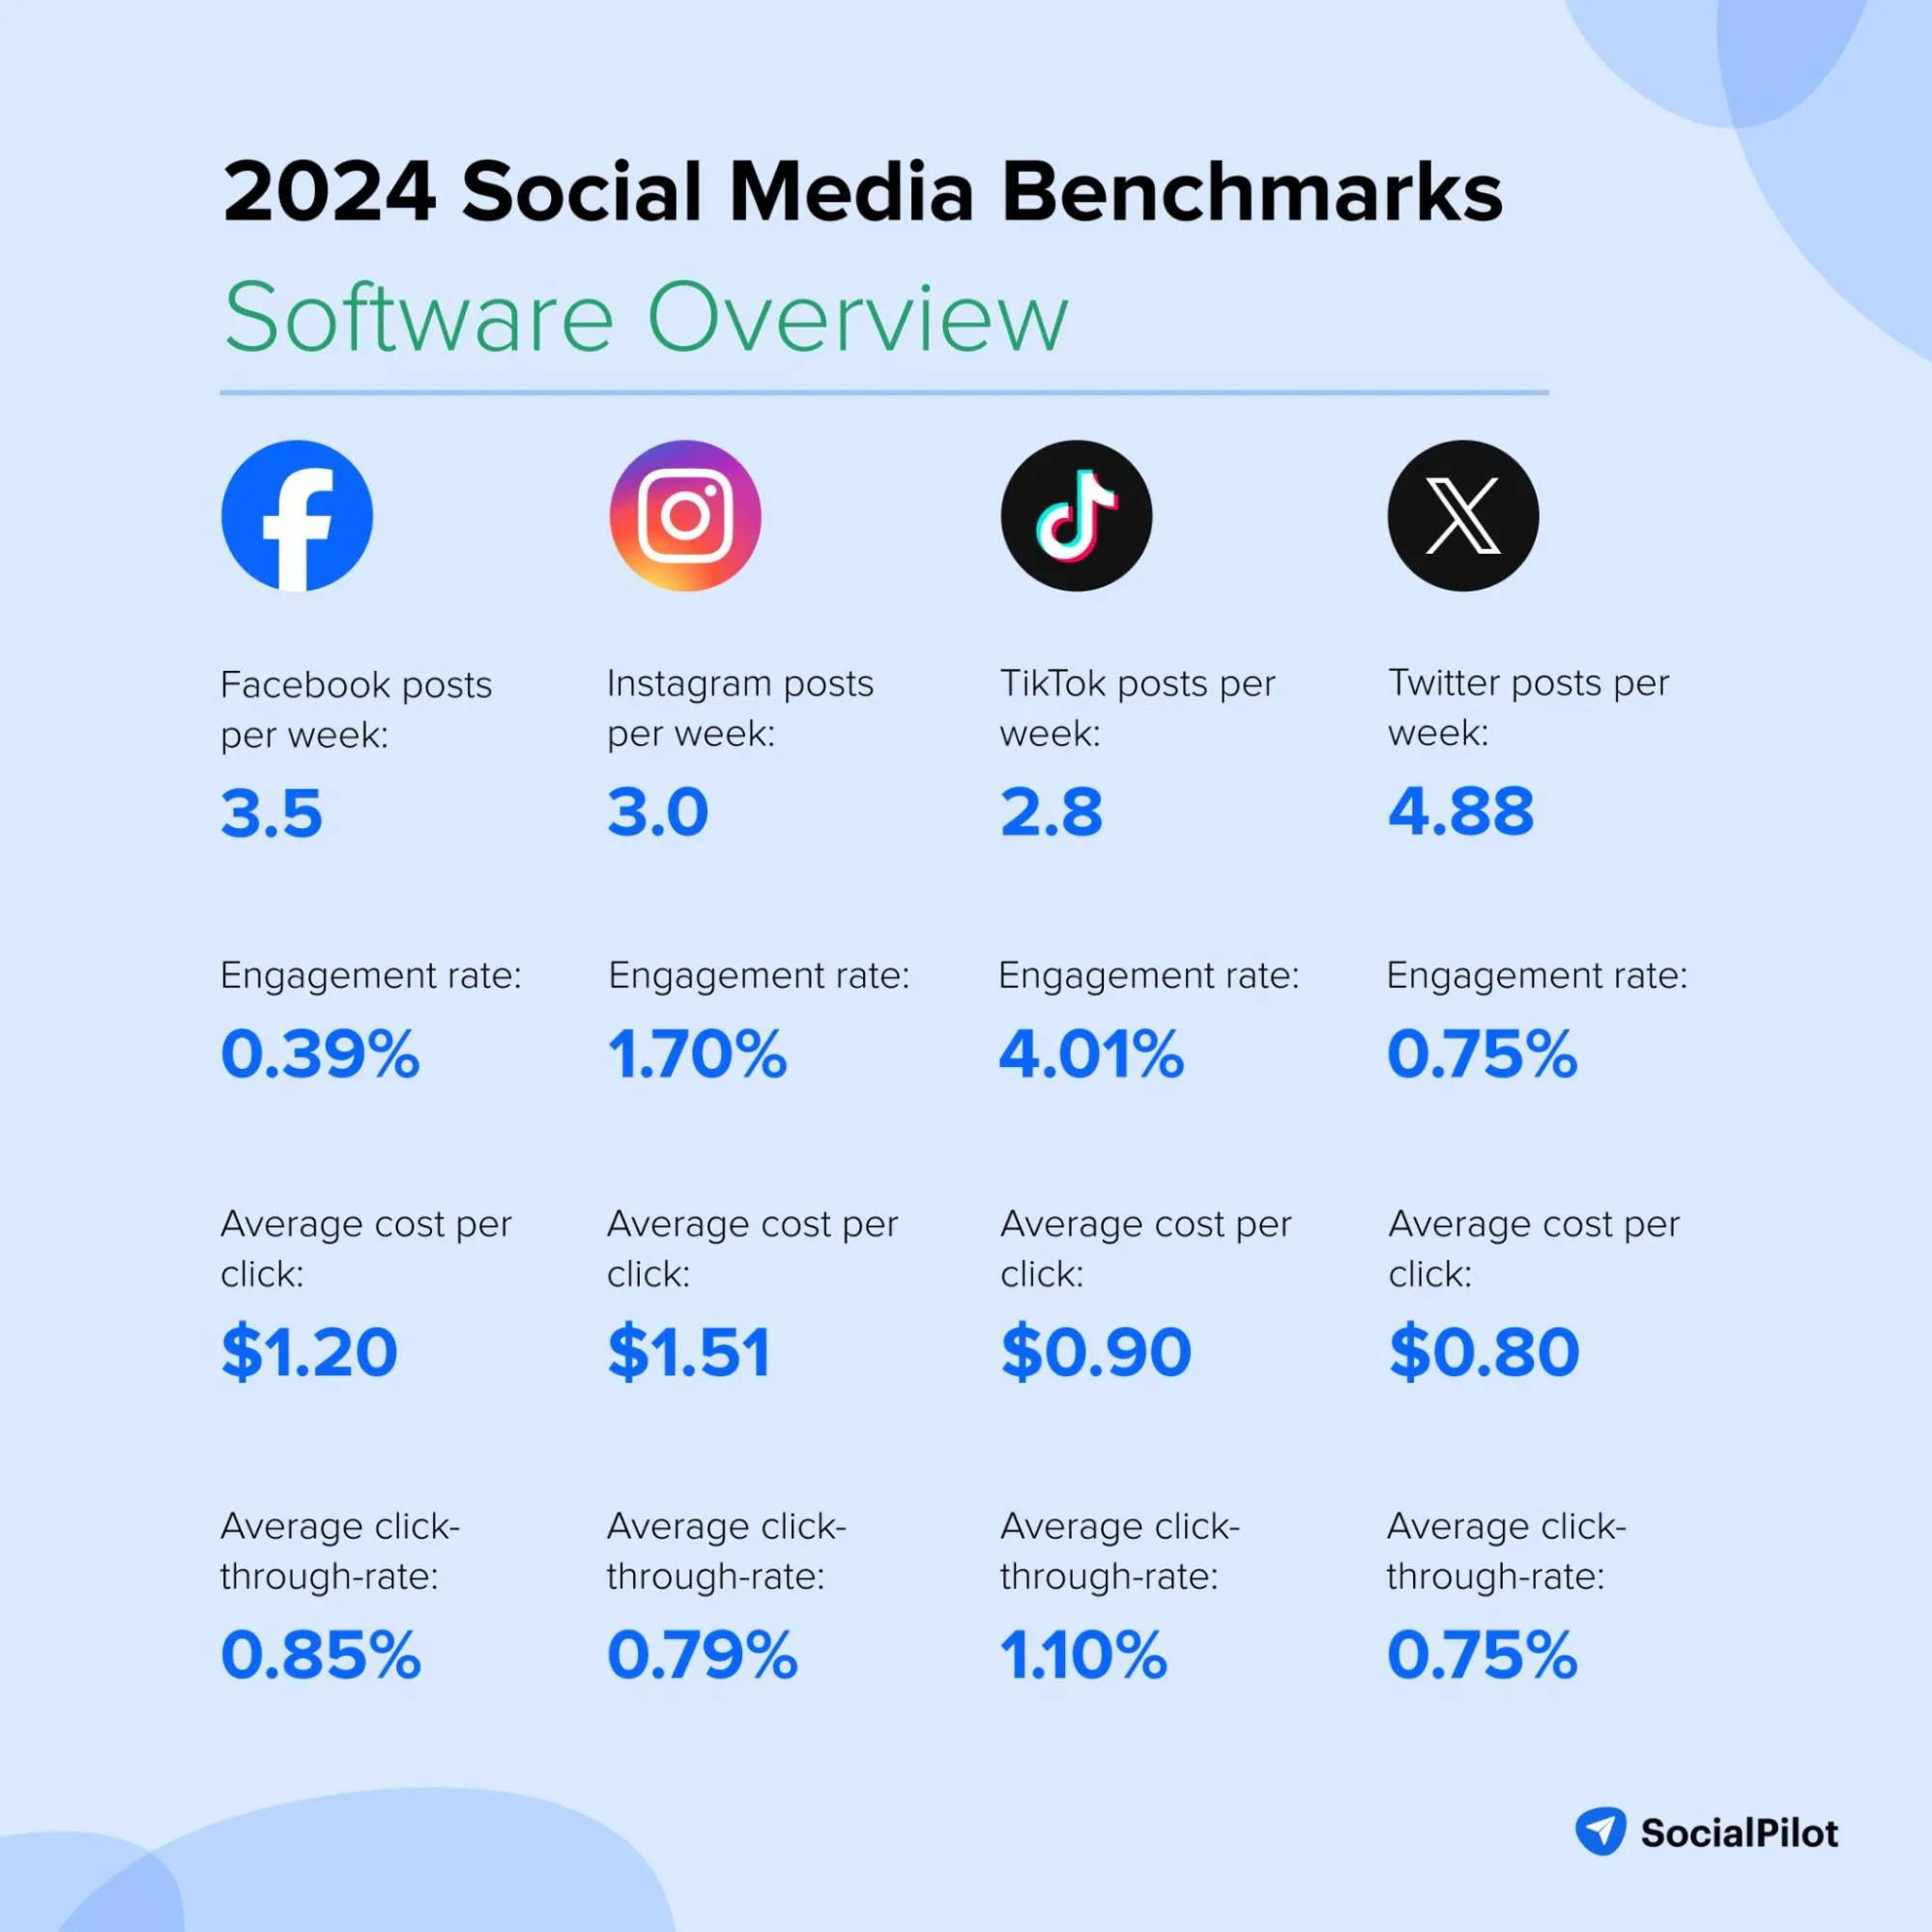
Software companies use social media to educate users about their products and services through informative content and tutorials. Twitter is the key platform for sharing industry insights and product updates and engaging with a professional audience. Video demos and webinars are particularly effective in demonstrating product capabilities and driving user engagement.
- Facebook posts per week: 3.5
- Facebook engagement rate: 0.39%
- Facebook average cost per click: $1.20
- Facebook average click-through-rate: 0.85%
- Instagram posts per week: 3.0
- Instagram engagement rate: 1.70%
- Instagram average cost per click: $1.51
- Instagram average click-through-rate: 0.79%
- TikTok posts per week: 2.8
- TikTok engagement rate: 4.01%
- TikTok average cost per click: $0.90
- TikTok average click-through-rate: 1.10%
- Twitter posts per week: 4.88
- Twitter engagement rate: 0.75%
- Twitter average cost per click: $0.80
- Twitter average click-through-rate: 0.75%
Travel Social Media Benchmarks
The travel industry thrives on social media by sharing stunning travel visuals and journey tails. Instagram and TikTok are the most effective platforms, where breathtaking photos and short travel videos are posted to captivate audiences. The average TikTok engagement rate for the travel industry is a staggering 5.30%.
- Facebook posts per week: 4.19
- Facebook engagement rate: 0.65%
- Facebook average cost per click: $0.60
- Facebook average click-through-rate: 1.12%
- Instagram posts per week: 5.23
- Instagram engagement rate: 2.76%
- Instagram average cost per click: $0.70
- Instagram average click-through-rate: 1.10%
- TikTok posts per week: 6.5
- TikTok engagement rate: 5.30%
- TikTok average cost per click: $0.45
- TikTok average click-through-rate: 1.45%
- Twitter posts per week: 5.5
- Twitter engagement rate: 0.81%
- Twitter average cost per click: $0.50
- Twitter average click-through-rate: 0.93%
Social Media Engagement Benchmarks by Network
Businesses need to evaluate their performance by using standard points to measure their social media performance and track the success of their efforts. Network-specific benchmarks help identify the platform’s potential so you can set realistic and achievable social media goals for growth and engagement.
Facebook Engagement Benchmarks
Since its downfall, Facebook’s median engagement rate, currently at 0.018%, is the lowest it has been. Brands are posting less on Facebook, which has started negatively affecting some industries.
At SocialPilot, we found that videos are the most engaging content format on Facebook, with engagement rates as high as 4.15%. We found the best times to post on Facebook are Wednesdays and Thursdays from 7 a.m. to 9 a.m., 1 p.m. to 3 p.m., and 7 p.m. to 9 p.m.
- Posts per week: 3.78
- Engagement rate: 0.018%
- Growth rate: 0.2%
- Average CTR: 0.90%
- Best performing content format: Videos (1.05%)
- Best time to post on Facebook: Mid-week (7-9 am, 1-3 pm, and 7-9 pm)
Instagram Engagement Benchmarks
Instagram witnessed a moderate increase in posting frequency, with the new median number going up to 5 per week. Engagement rates remained stagnant at 0.90% across all surveyed industries on the platform, with non-profit, software and higher education being the top contributors. Furthermore, the average best time to post on Instagram is between 7 and 9 a.m. on weekdays.
- Posts per week: 5
- Engagement rate: 0.90%
- Growth rate: 1.15%
- Average CTR: 0.52%
- Best performing content format: Reels (1.62%)
- Best time to post on Instagram: Weekdays (7-9 am)
Twitter Engagement Benchmarks
Since the renaming of X from Twitter, the platform has seen a historical all-time dip in engagement, currently standing at 0.05%. It is no surprise that due to the volatile nature of the platform, brands have reduced postings on the network, but not all industries are seeing this change.
The media industry still stands tall with the highest posting frequency. Based on our findings at SocialPilot, the best time to post on Twitter is on weekdays at 8-10 am and 6-9 pm.
- Posts per week: 3.35
- Engagement rate: 0.05%
- Growth rate: 0.15%
- Average CTR: 1.55%
- Best performing content format: Polls (0.20%)
- Best time to post on Twitter: Weekdays (8-10 am)
TikTok Engagement Benchmarks
Since its debut as a lip-syncing and dancing challenge platform to become one of the fastest-growing social media platforms in the industry, TikTok has come a long way. TikTok videos continue to beat all platforms with a staggering median engagement rate of 2.65% by followers. Moreover, the best time to post on TikTok is between 10-12 pm on Tuesday and Thursday.
- Posts per week: 3.7
- Engagement rate: 2.65%
- Growth rate: 2.10%
- Average CTR: 0.84%
- Best time to post on TikTok: Tuesday and Thursday (10-12 pm)
Linkedin Engagement Benchmarks
Over the years, LinkedIn has transformed from a professional networking platform to a go-to marketing tool for B2B businesses. The average engagement rate on LinkedIn, 0.54%, is much lower than that on Instagram and in no way comparable to TikTok. Videos drove the highest engagement rates for brands on LinkedIn. Also, when it came to posting on LinkedIn, we found that 10-12 a.m. on Tuesday, Wednesday, and Thursday is the best time.
- Posts per week: 2.66
- Engagement rate: 0.54%
- Growth rate: 0.25%
- Average CTR: 0.39 – 0.65%
- Best performing content format: Videos
- Best time to post on LinkedIn: Tuesday, Wednesday, and Thursday (10-12 am)
There you have it all: we have shared all the important benchmark scores for the industries and social media platforms. Finally, it is time for you to find your benchmark scores and compare them with these industry standards to understand how your performance compares to your competitors.
How to Find Your Benchmarks for Social Media
Finding benchmarks can be frustrating, especially when you are not using a tool. SocialPilot makes it easy for businesses and agencies to collect the performance data of all their social media accounts in one cohesive dashboard and utilize it to establish benchmarks.
With the built-in social media analytics, you can track all of your profiles’ key performance indicators (KPIs). Use the above benchmark scores to compare them to industry standards.
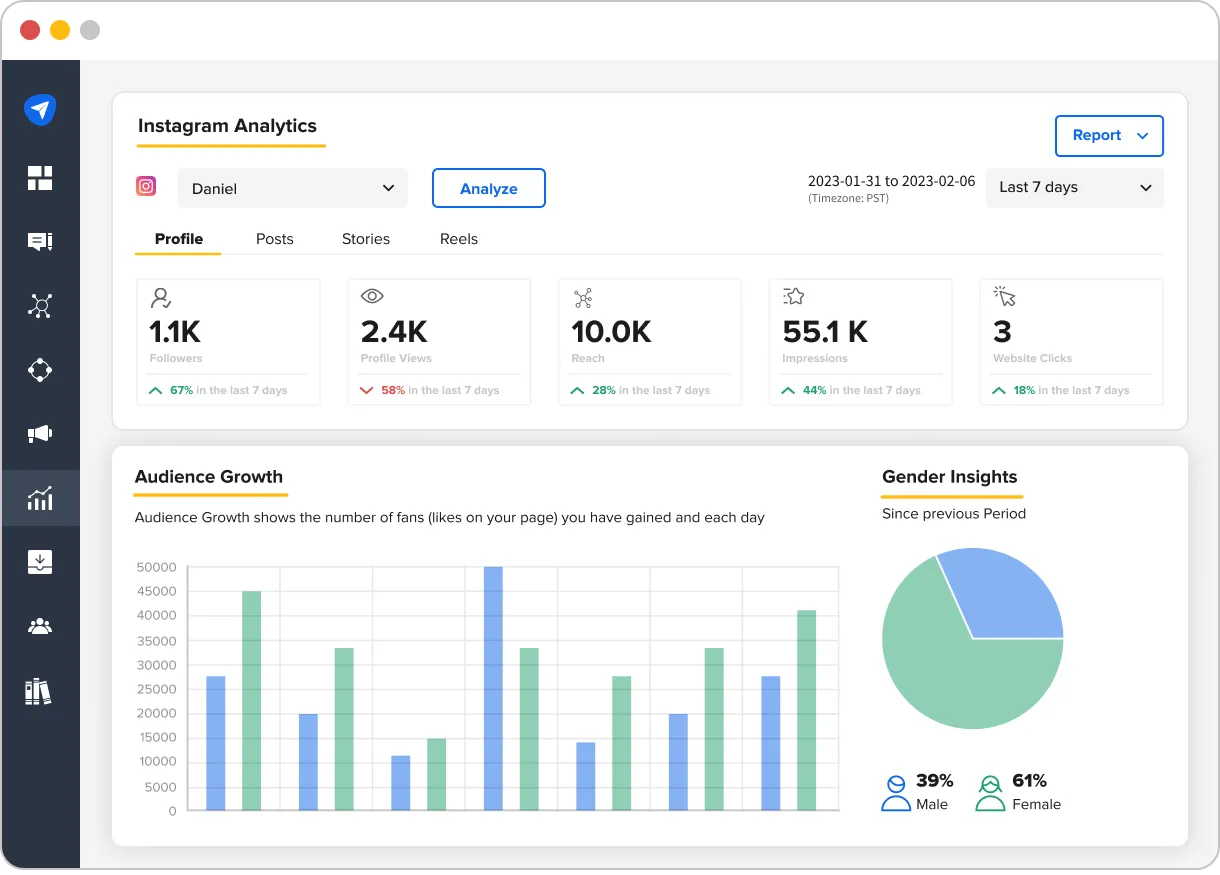
You can track key metrics such as profile views, reach, engagement rate, posting frequency, impressions, follower growth, best time to post, post-performance, shares, and more. Once you’re done analyzing the metrics, you can use Advanced Reports to create a comprehensive report of all your social media accounts containing all your findings.
If you want to share it with your team or stakeholders, you can download it as a PDF or schedule it. It is that easy to get a run for your money and refine your social media strategies.
Start your 14-day free trial
Furthermore, here are some termonologies you need to know while doing social media benchmarking:
- Posting frequency: The number of posts you publish per day.
- Audience growth rate: It is the (number of new followers – old followers) divided by old followers and multiplied by 100.
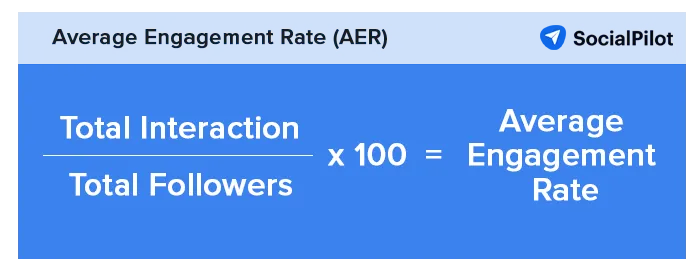
- Average engagement rate: It is the total interaction (sum of likes, comments, shares, etc) / total followers x 100
- Click-through rates (CTR): It is the number of people who clicked the ad divided by the number of people who saw the ad multiplied by 100
- Cost per click: It is the total ad spend divided by total clicks multiplied by 1000.
You can use these social media metrics to track and analyze your current performance.
Once you have found your own benchmarks, it’s time to start utilizing them.
How to Use Social Media Industry Benchmarks in Your Strategy
Benchmarks are not just any random metrics; they are a clear statement of how the current social media industry is performing. These benchmarks can offer wide-scale benefits if you use them with your social media strategy and devise a clear, actionable plan for your business.
Set Realistic Goals
The foundation of any successful social media strategy is a clear understanding of your current performance. Once you have found the numbers of your social media profiles, you need to compare them to industry standards to understand where you’re falling short. Do not blindly chase numbers; use benchmarks to set achievable and relevant goals.
For example, if you want to increase your Instagram engagement to 3%, remember that the average is only 0.90%. Use these benchmarks to set realistic goals and KPIs. Go ahead with the SMART framework to ensure your goals align with industry standards.
Stay Competitive
The next step is to take a look at the competitor landscape. Competitive benchmarking allows you to compare your performance with competitors in your industry. Use competitive analysis to identify industry leaders and decode the strategies of brands exceeding benchmarks in your industry.
You can easily analyze their content formats, engagement tactics, and posting frequencies by going through their profiles.
Once you understand these, it is time to refine your strategy.
Optimize Strategies
It’s not just about setting goals; it’s about making continuous improvements based on the metrics. Use a social media audit to evaluate your presence comprehensively and analyze what content types best resonate with your target audience.
Benchmark data can help you identify optimal posting schedules to maximize reach and engagement.
Analyze which platforms deliver the best results for your industry and target audience. By following these steps, you can craft a data-driven strategy that drives results for your business.
Wrapping Up
There you have it, folks!
You’re all set to start with your social media benchmarks. Use these to set a clear reference point for your strategy, measure performance goals accurately, set achievable goals, and stay competitive. The above industry benchmarks and network benchmarks will help you keep your efforts aligned and guide your strategy.